
Figure 3. Impact of enzyme saturation on flux regulation.
-
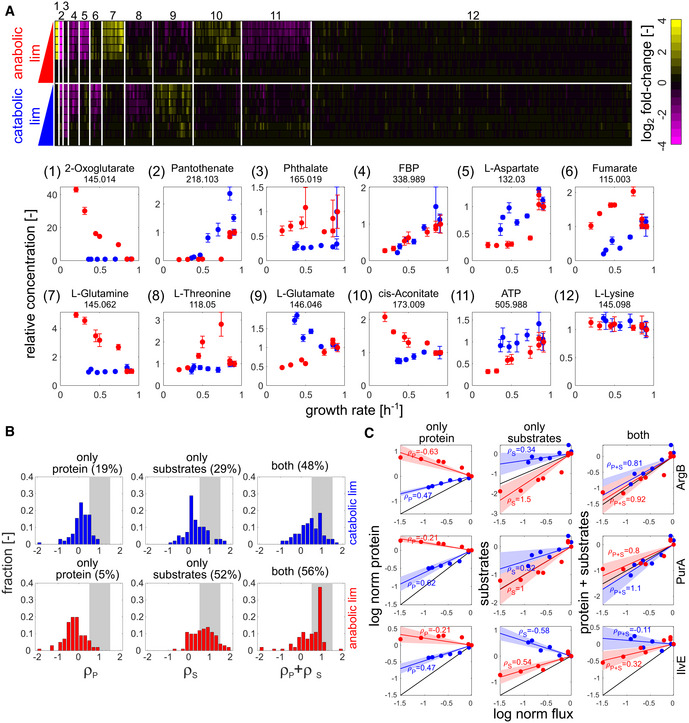
AIntracellular metabolome response (of 430 annotated ions) in mid‐exponential growth as determined by FIA‐TOF mass spectrometry. Upper panel: heatmap of log2 fold changes (relative to NCM3722 wild type) for both limitations. Annotated ions were sorted by K‐means clustering of log2 fold changes, using squared Euclidian distance as metric (Arthur & Vassilvitskii, 2007). Annotated ions showing little variation across conditions (coefficient of variance across all conditions < 30%) were filtered out before clustering and assigned to cluster 12. Lower panel: exemplary ions for each cluster plotted (in linear scale) against the respective growth rate. Numbers underneath metabolite names denote m/z. Error bars denote standard deviation of three biological replicates.
-
B, CDistribution of regulation coefficients quantifying the contribution of changes in protein concentration (left column) and enzyme saturation (middle column) to the explanation of observed flux changes, as well as their combined effect (right column). Upper panel: catabolic limitation. Lower panel: anabolic limitation. Only reactions for which at least one isoenzyme as well as all substrates had been quantified were considered in the analysis (total number of considered reactions: 108). The fraction of reactions with regulation coefficients between 0.5 and 1.5 is highlighted by gray areas. Individual exemplary reactions are shown in (C). Blue and red lines denote the estimated regulation between measured flux, protein, and metabolite concentrations for catabolic and anabolic limitation, respectively. Shaded areas denote the standard error of each corresponding estimate. Black lines denote full proportionality. ρ: corresponding regulation coefficients.