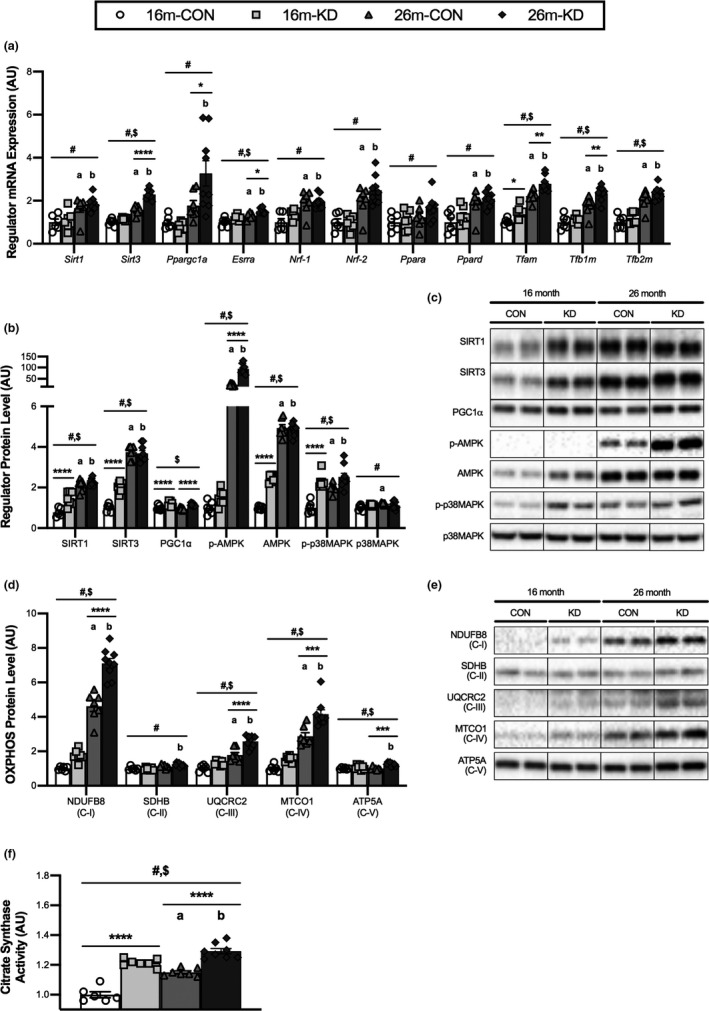
FIGURE 3.

Effect of diet and aging on mitochondrial biogenesis and oxidative metabolism. (a) mRNA expression of transcriptional regulators of mitochondrial biogenesis, protein levels, and representative western blot images of (b,c) regulators of mitochondrial biogenesis, (d,e) oxidative phosphorylation (OXPHOS) proteins from each complex (C‐I to C‐V) and (f) citrate synthase enzymatic activity from the GTN of 16‐ and 26‐month‐old mice on a control (CON) or ketogenic diet (KD). For complete western blot images refer to Appendix S1 (Figure S1). Values are expressed as means ± SEM. n = 6 (16‐month CON), n = 7 (16‐month KD and 26‐month CON), and n = 9 (26‐month KD). (#) main effect of age. ($) main effect of diet. (*p < 0.05; **p < 0.01; ***p < 0.001; ****p < 0.0001) comparing CON and KD at 16 and 26 months. (a) p < 0.05 comparing CON at 16 and 26 months. (b) p < 0.05 comparing KD at 16 and 26 months
