FIGURE 5.

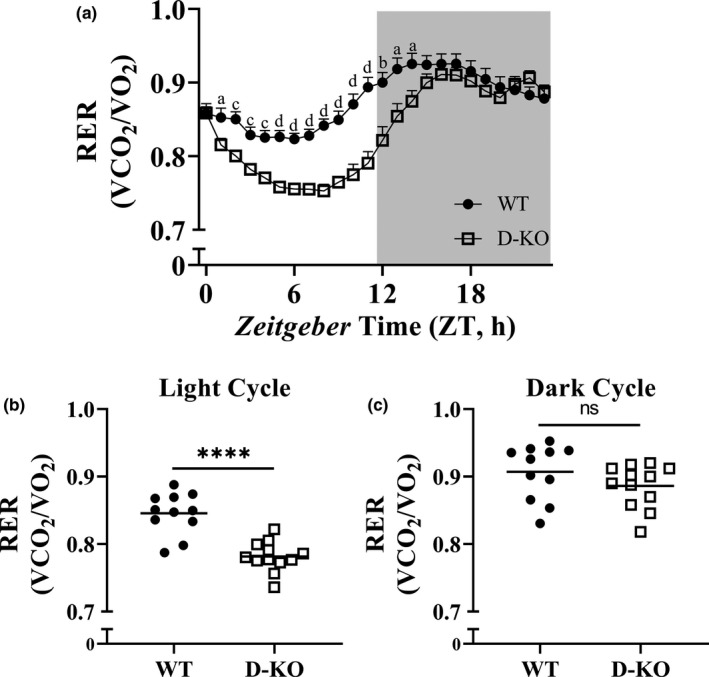
Respiratory exchange ratio (VCO2/VO2) in D‐KO mice. RER values were calculated by dividing VCO2 with VO2. RER data, which were collected during a 6‐day period, were averaged into a single day format (a). Averaged RER values are shown as light (b) and dark (c) cycles for WT and D‐KO mice. Female WT n = 11, D‐KO n = 12. Each bar represents mean ±SEM. Statistical analysis was performed with unpaired Student's t test with Welch's correction; ns=not significant, a; *p < 0.05, b; **p < 0.01, c; ***p < 0.001, d; ****p < 0.0001
