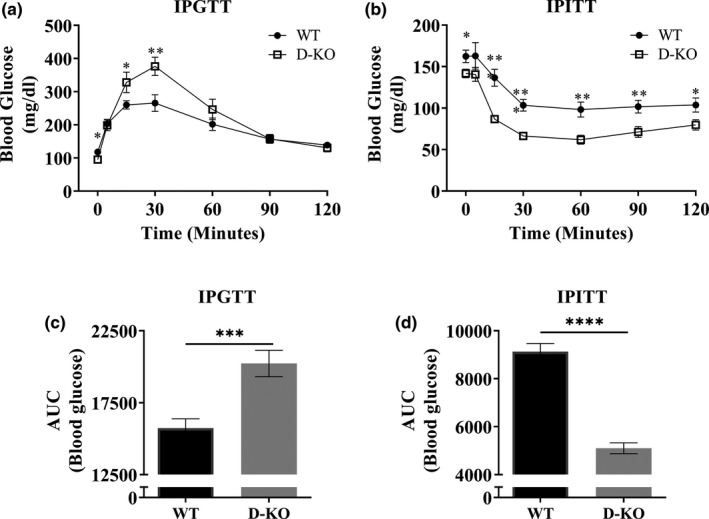
FIGURE 6.

Insulin and glucose tolerance tests. D‐KO and WT mice were fasted overnight and injected with 1 g glucose per kg of body weight. Blood glucose levels of mice were measured during the following 2 hours (a). Area under the curve analysis is shown (c). D‐KO and WT mice were fasted for 4 hours and injected with 1 IU porcine insulin per kg of body weight. Blood glucose levels of mice were measured during the following 2 hours (b). Area under the curve analysis is shown (d). WT n = 13–14, D‐KO n = 10–11. Each bar represents mean ±SEM. Statistical analysis was performed with unpaired Student's t test with Welch's correction; *p < 0.05, **p < 0.01, ***p < 0.001, ****p < 0.0001
