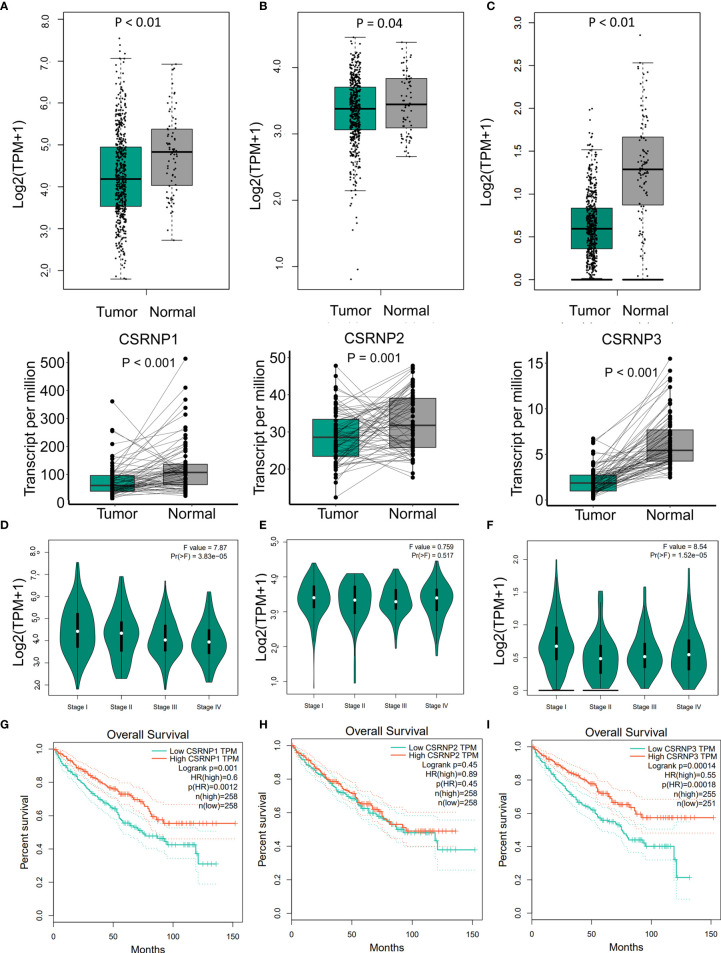
Figure 1.
mRNA expression, stage-specific expression, and overall survival of CSRNP gene family members according to GEPIA. (A–C) mRNA expression of CSRNP family members in tumor and normal tissues (upper image), and paired tumor and normal tissues (lower image). Green: tumor tissues; gray: normal tissues. (D–F) Stage-specific mRNA expression of CSRNP family members. (G–I) Kaplan-Meier curves of the overall survival analysis in relation to the CSRNP family.

