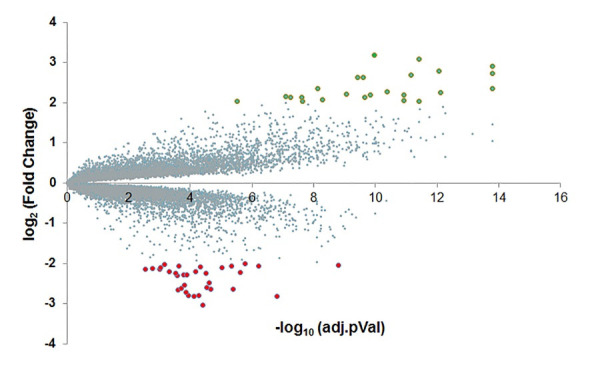
Figure 1. Volcano plot for the differentially expressed genes (DEGs) identified from matching pairs of tumor tissue and adjacent non-tumor tissue from 45 pancreatic ductal adenocarcinoma (PDAC) patients.

The up- and down-regulated genes, significantly upregulated DEGs (log2(fold change) > 2) and significantly downregulated DEGs (log2(fold change) < -2) were shown in cadet blue, green and red dots, respectively. The top 15 up- and down-regulated genes were also listed in Table 1
