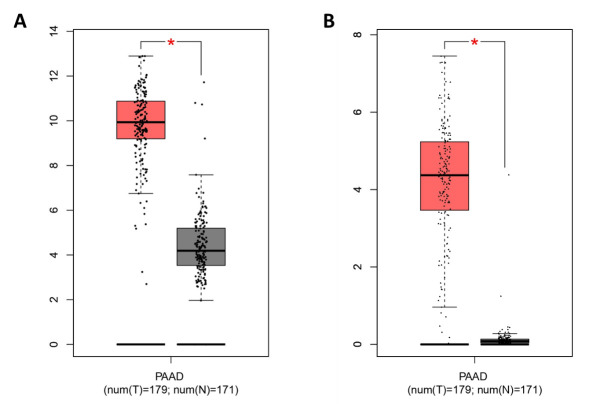
Figure 6. Boxplots showing the expression of gene FN1 (A) and SERPINB5 (B) in PDAC patients versus normal controls in patient dataset PAAD deposited in The Cancer Genome Atlas (TCGA).
This figure was generated using online software GEPIA (http://gepia.cancer-pku.cn).

