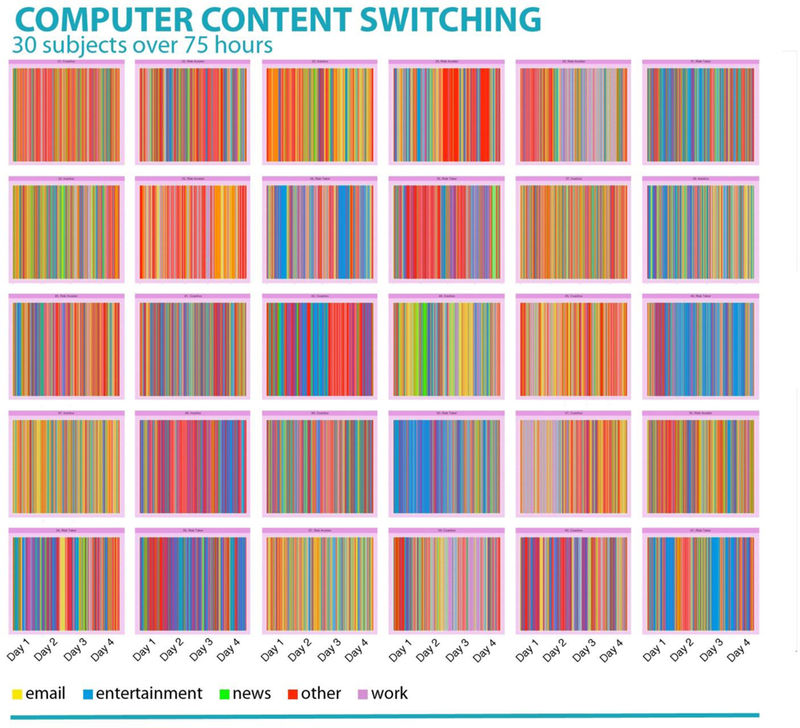
Figure 6.

Intraindividual variation in laptop screenshot content categories over the course of four days for 30 people. Each panel of vertical colored lines represents a unique person and each vertical line represents time spent in five different categories of content. Both within-person and between-person differences are evident across panels.
