
Figure 7.
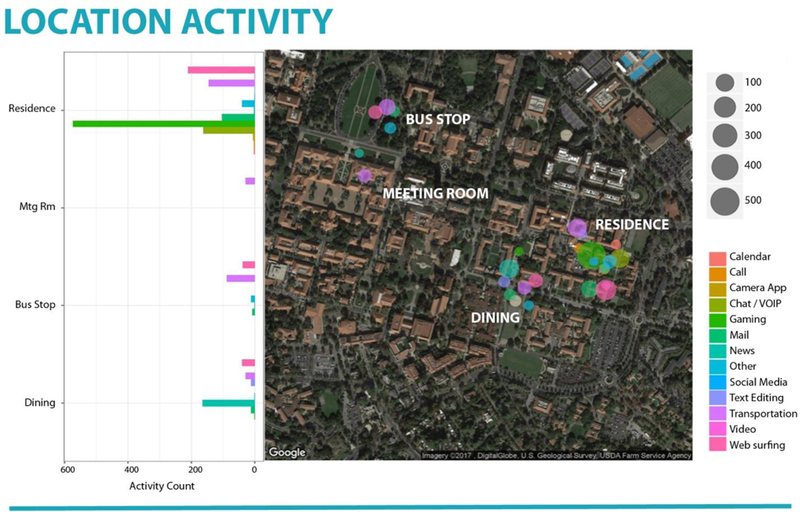
Barplot and map of a person’s screen activity for one day within one city. Locations visited include (from top to bottom of barplot): residence, meeting room, bus stop, and dining establishment.
Official websites use .gov
A
.gov website belongs to an official
government organization in the United States.
Secure .gov websites use HTTPS
A lock (
) or https:// means you've safely
connected to the .gov website. Share sensitive
information only on official, secure websites.
Barplot and map of a person’s screen activity for one day within one city. Locations visited include (from top to bottom of barplot): residence, meeting room, bus stop, and dining establishment.