
Figure 8.
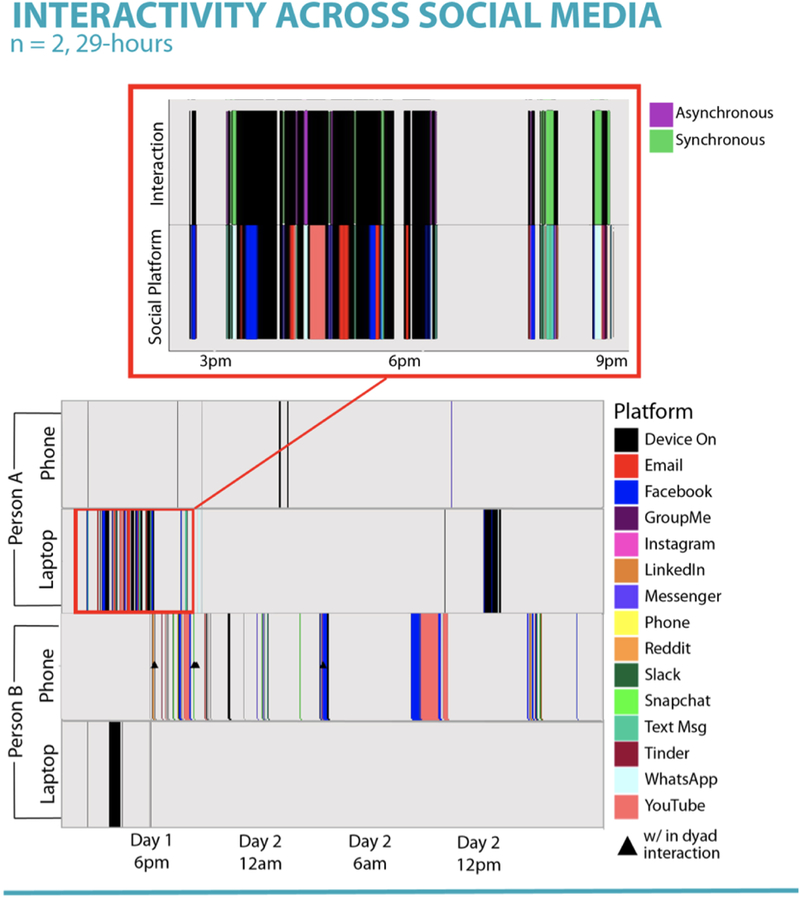
Panels depicts two individuals’ social media use during a 29-hour period on both laptops and smartphones. Each color represents a different interpersonal media platform, with black indicating device use that was not on a social media platform, and gray indicating that the device was off. Zoomed panel shows detail of asynchronous and synchronous communication during a specific 3-hour period.