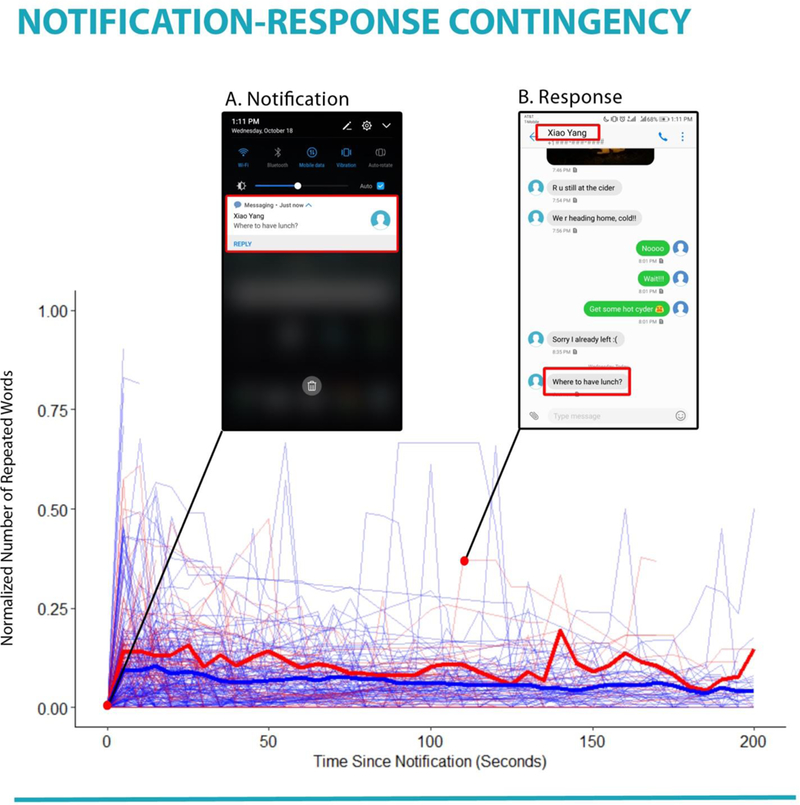
Figure 9.

The graph shows how the content of specific notification stimuli manifested in the screenshots following that notification. Red lines indicate notifications characterized as social cues, and blue lines indicate notifications with non-social cues. Bold lines provide the response profile for each type of cue, as averaged across all notifications in the two cue types. Inserts highlight a specific notification cue, and the moment, 115 s later, that the content of the cue returned (i.e., the response).
