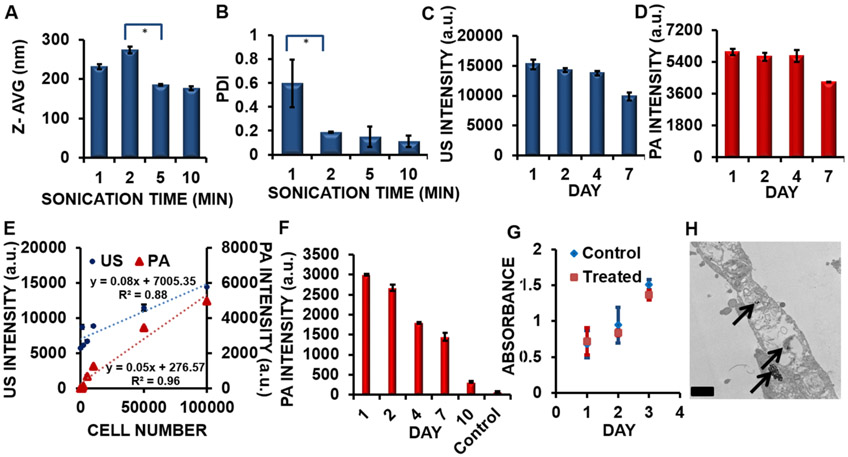
Figure 2.
Optimization of synthesis parameters and cell number detection. (A) Increased sonication time after 2 min resulted in a smaller nanobubble size, with the effects negligible after 5 min of sonication. (*) p value < 0.05. (B) Increasing the sonication time from 1 to 2 min resulted in a decrease in the PDI from 0.60 to 0.19. (*) p value < 0.05. (C) The US signal of the nanobubble remained stable for 4 days and decreased by approximately 35% after 7 days (p value < 0.05). (D) The PA signal of the nanobubble remained stable for 4 days and decreased by approximately 28% after 7 days (p value < 0.05). (E) The limit of detection of hMSCs labeled with nanobubbles (incubation time = 6 h; concentration = 240 μg/mL) was 10461 cells for US imaging and 996 cells for PA imaging. The primary y axis indicates the US intensity (blue circles) of hMSCs treated with nanobubbles from 0 to 100000 cells. The secondary y axis indicates the PA intensity (red triangles) of hMSCs treated with nanobubbles from 0 to 100000 cells. Error bars represent the standard error (n = 8). (F) PA intensity data show that cells (100000 cells; incubation time = 6 h; concentration = 240 μg/mL) were detectable for 10 days in a phantom (p value < 0.05). (G) A cell viability assay showing the growth kinetics of hMSCs. Treated cells (red squares) and control cells (blue diamonds) doubled in approximately 3 days. Error bars represent the standard error (n = 8). (H) TEM imaging of a hMSC treated with nanobubbles. The black arrows indicate the location of the nanobubbles within the cytoplasm of the hMSC. Scale bar = 0.5 μm.

