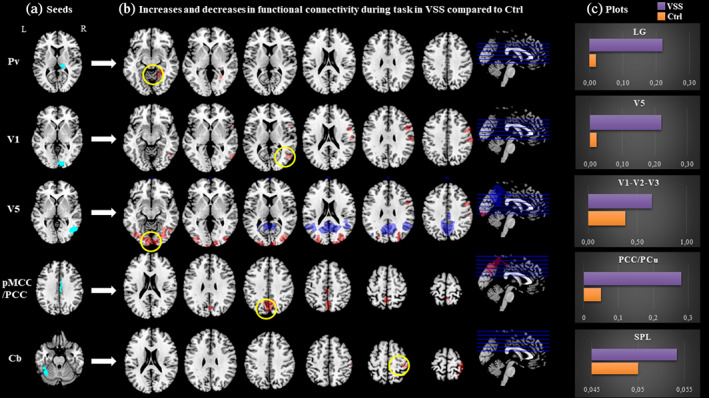
FIGURE 2.

Main task‐based connectivity differences between VSS patients and healthy controls. (a) Location of selected seed regions (in cyan). (b) Between‐group functional connectivity maps from each seed region to the whole brain in VSS patients compared with controls. Blue refers to reduced coupling compared with Ctrls, red refers to increased coupling. Maps are thresholded at P < .001 and cluster corrected to P < .05. For T and k values refer to Table 2. (c) Plots for clusters with highest T value (circled in yellow), with respective bar charts of beta values for the two groups (VSS in purple, Ctrl in orange). Pv, pulvinar; V1, right primary visual area; V5, right V5 area; pMCC/PCC, posterior midcingulate cortex/posterior cingulate cortex; Cb, left cerebellum lobule VI; LG, lingual gyrus; SPL, superior parietal lobule
