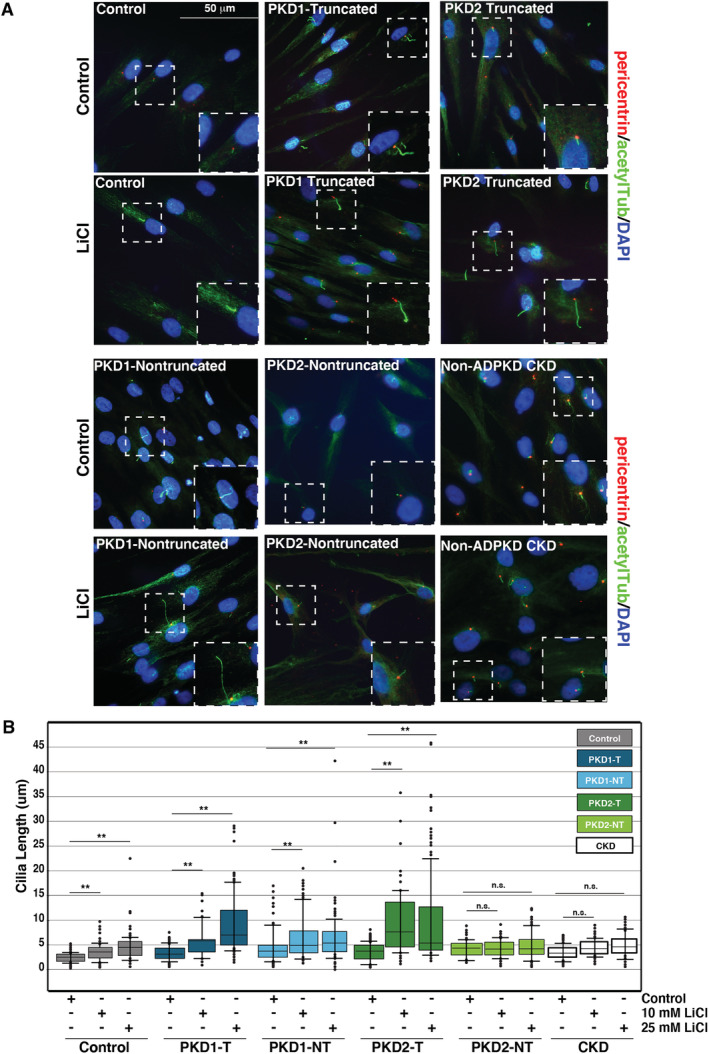
Fig 2.

Primary cilia elongation by lithium chloride (LiCl) is enhanced in autosomal dominant polycystic kidney disease (ADPKD) osteoblasts. (A) Primary cultured osteoblasts from patients with ADPKD, non‐ADPKD chronic kidney disease (CKD), and healthy controls treated with 10mM LiCl or control medium and stained with the antibodies pericentrin (red) and acetylated tubulin (green) for immunofluorescence analyses. Nuclei were marked by 4,6‐diamidino‐2‐phenylindole (DAPI; blue). White‐dashed boxes mark representative cilia from each condition: healthy controls, PKD1‐truncated (PKD1‐T), PKD1‐nontruncated (PKD1‐NT), PKD2‐truncated (PKD2‐T), and PKD2‐nontruncated (PKD2‐NT). (B) Scatter‐plot quantification of cilia length following 10mM LiCl, 25mM LiCl, and control treatments in serum‐starved osteoblasts from patients with ADPKD and non‐ADPKD CKD, and healthy controls. Healthy cilia increased from 2.6 ± 0.1 μm in serum‐starved cells to 3.5 ± 0.2 μm with 10mM LiCl and 4.95 ± 0.3 μm with 25mM LiCl (**p < 0.001). PKD1‐T cilia increased from 3.9 ± 0.2 μm in control treatments to 5.4 ± 0.3 μm with 10mM LiCl and 9.4 ± 0.5 μm with 25mM LiCl (**p < 0.001). PKD1‐NT cilia increased from 4.2 ± 0.2 μm to 5.5 ± 0.3 μm and 8.7 ± 0.7 μm (**p < 0.001). PKD2‐T cilia increased from 3.7 ± 0.2 μm in control treatments to 7.3 ± 0.4 μm with 10mM LiCl and 7.4 ± 0.4 μm with 25mM LiCl (**p < 0.001). PKD2‐NT cilia did not significantly increase following LiCl treatment (4.4 ± 0.2 μm in controls; 4.3 ± 0.2 μm with 10mM LiCl; 5.1 ± 0.2 μm with 25mM LiCl; **p < 0.001). Error bars indicate mean ± SEM (n > 200). p Values were calculated by Bonferroni corrected pairwise comparisons. Scale bar = 50 μm.
