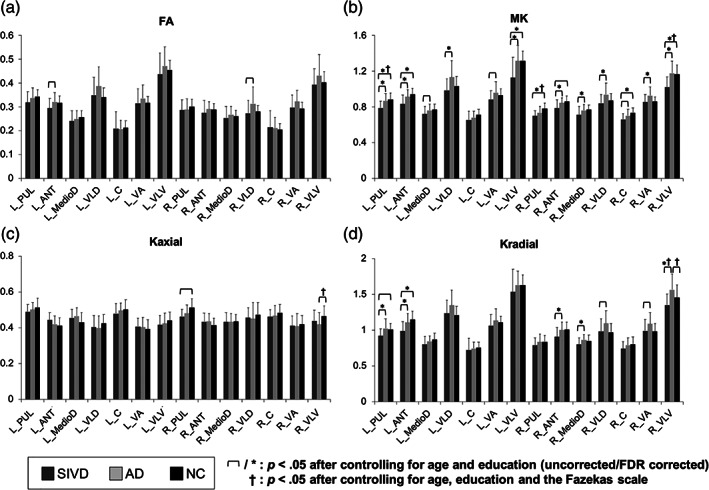
FIGURE 4.

Between‐group comparisons of (a) FA, (b) MK, (c) K axial, and (d) K radial in segregated thalamic regions. Thin brackets indicate between‐group differences with significant p values <.05 after controlling for age and education (FDR uncorrected). Asterisks (*) indicate between‐group differences with significant p values <.05 after controlling for age and education (FDR corrected). Daggers (†) indicate significant between‐group differences with significant p values <.05 noted after controlling for age, education, and the Fazekas scale. SIVD, subcortical ischemic vascular disease; AD, Alzheimer's disease; NC, normal cognition; DKI, diffusion kurtosis imaging; FA, fractional anisotropy; MK, mean kurtosis; K axial, axial kurtosis; K radial, radial kurtosis; PUL, pulvinar; ANT, anterior; MedioD, mediodorsal; VLD, ventral–lateral–dorsal; C, central; VA, ventral‐anterior; VLV, ventral–lateral–ventral; L, left; R = right
