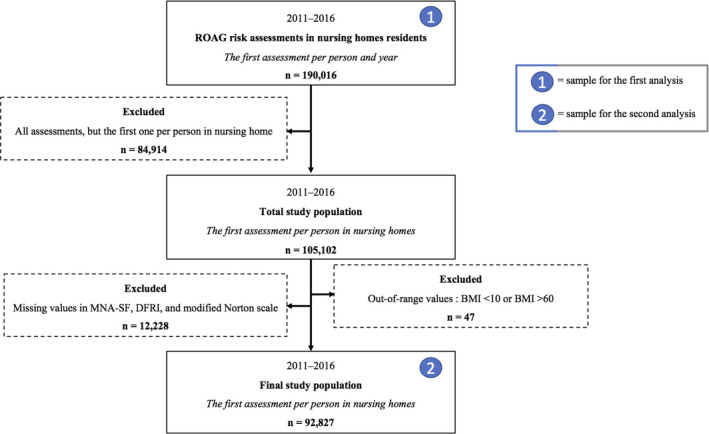
FIGURE 1.

A flow chart showing the samples for the first analysis, to describe the extent to which ROAG‐J in SA is used in nursing homes and whether there are any demographic differences in use between regions in Sweden, and for the second analysis, to investigate oral health status assessed by ROAG‐J in relation to age, gender, physical condition, neurophysiological problems, BMI, mobility, and medication
