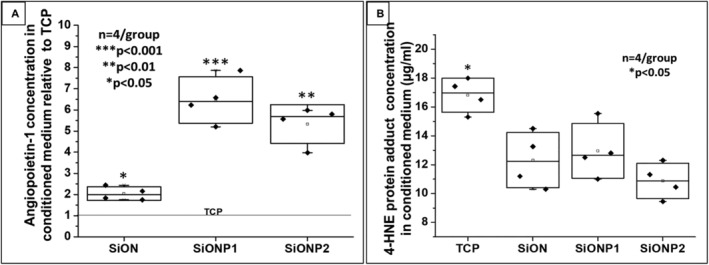
Fig 4.

(A) ANG1 concentration in conditioned medium relative to TCP (control). ANOVA (Tukey's pairwise) was used for analysis and bicinchoninic acid assay was used to quantify the amount of ANG1 per μg of total protein on each sample. ***p < 0.001, **p < 0.01, and *p < 0.05, compared with TCP group. (B) 4‐HNE protein adduct concentration in conditioned medium. Graph of data analysis after ANOVA (Tukey's pairwise). The conditioned medium was obtained from human umbilical vein endothelial cell culture after 24 hours in toxic oxidative stress induced by 0.6mM hydrogen peroxide. *p < 0.05, compared to each of the other groups. 4‐HNE = 4‐Hydroxynonenal; ANG1 = angiopoietin 1; SiON = silicon oxynitride; SiONP = silicon oxynitrophosphide; TCP = tissue culture plate. n = 4.
