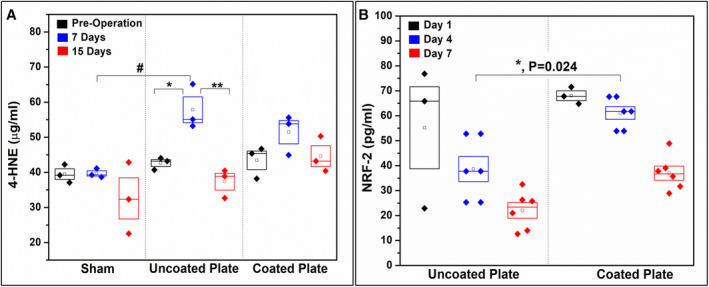
Fig 7.

Bar graph shows 4‐HNE protein adduct concentration in the rat serum presurgery, 7 days postsurgery, and 15 days postsurgery (competitive ELISA). *p < 0.05 (one‐way ANOVA—Tukey's pairwise within the uncoated “bare” implant group) and #p < 0.05 (one‐way ANOVA—Tukey's pairwise, same time point different groups).
