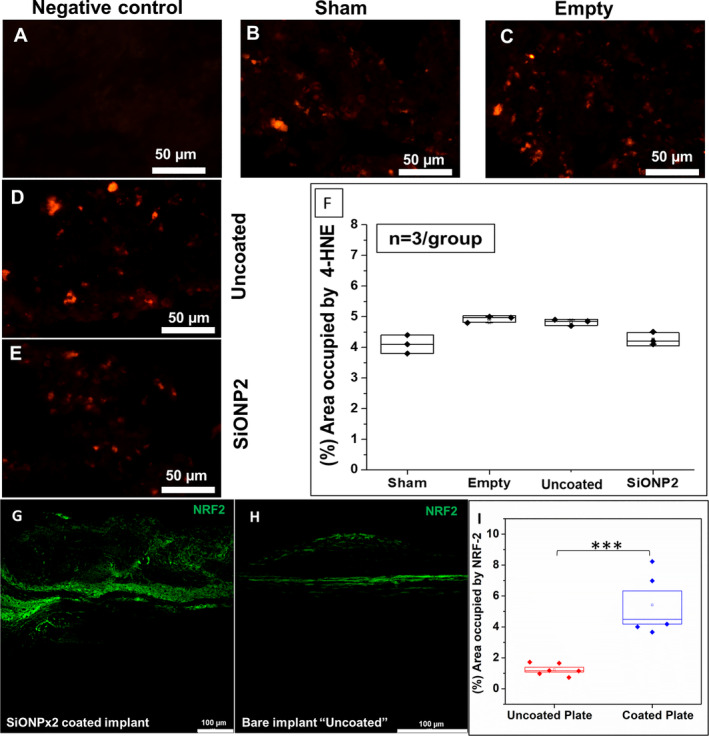
Fig 11.

Immunofluorescence staining (Alexa Fluor 594) for 4‐HNE and (Alexa Fluor 488) for NRF‐2, 15 days after implantation. Scale bar = 50 μm. (A) Negative control. (B) Sham. (C) Empty defect. (D) Uncoated “bare” implant. (E) SiONP2. (F) Percentage of area occupied by 4‐HNE. After one‐way ANOVA—Tukey's pairwise, it was not detected difference among the studied groups (p > 0.05). (G) SiONPx2. (H) Bare implant. (I) Percentage of area occupied by NRF2. 4‐HNE = 4‐Hydroxynonenal; NRF2 = nuclear factor erythroid 2‐related factor 2; SiONP = silicon oxynitrophosphide. Statistical difference, ***p < 0.001.
