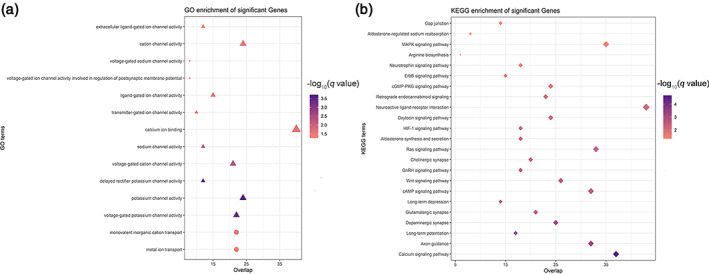
FIGURE 4.

Biological function analysis for FCS‐related genes. The GO (a) and KEGG (b) enrichment analyses show that FCS‐related genes are significantly enriched for ion channels, axon guidance pathway, and synaptic transmission processes. The color bars represent the ‐log10 (q value) of BH‐FDR correction. The size of the circles (biological processes), triangles (molecular functions), and rhombus (KEGG terms) represents the gene number hit on the terms. Abbreviations: GO, gene ontology; KEGG, Kyoto encyclopedia of genes and genomes
