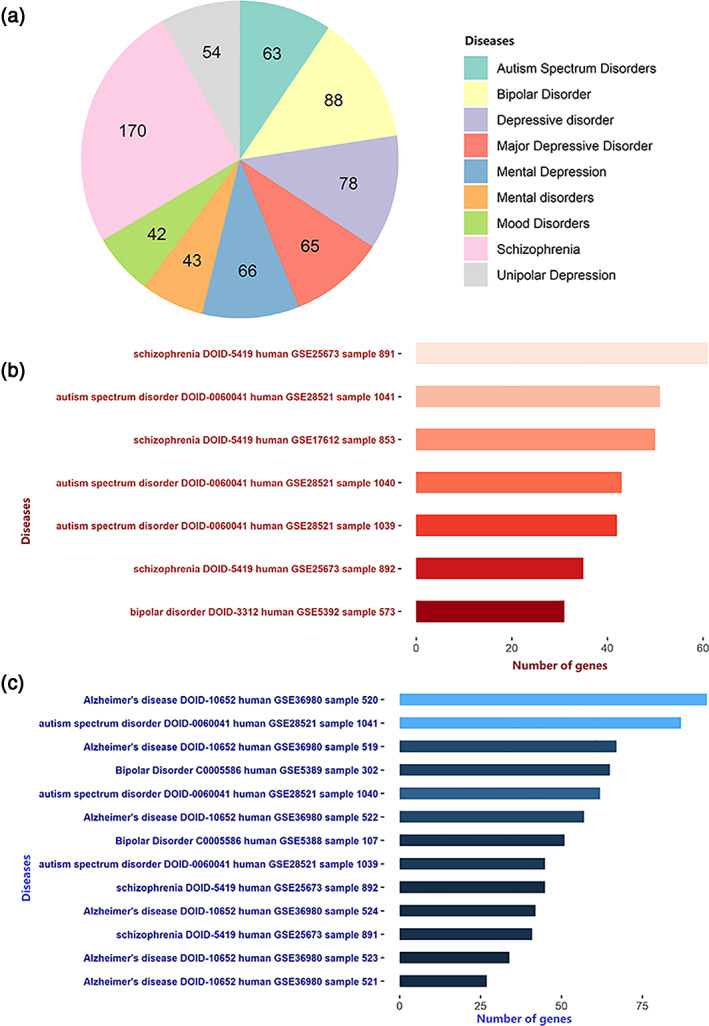
FIGURE 5.

Disease enrichment analysis for the FCS‐related genes. (a) ToppGene shows the number of FCS‐related genes associated with neurodegenerative and neuropsychiatric disorders. Enrichr shows that FCS‐related genes are enriched for genes with different expression patterns in patients with neurodegenerative and neuropsychiatric diseases; the red and blue bars indicate upregulated (b) and downregulated (c) genes, respectively. The colors indicate the significances of enrichment. These data are obtained from Gene Expression Omnibus (GEO) data sets, and the text on the left shows the name of the disease, disease ID, species, GEO Series (GSE) ID, and sample ID for each term
