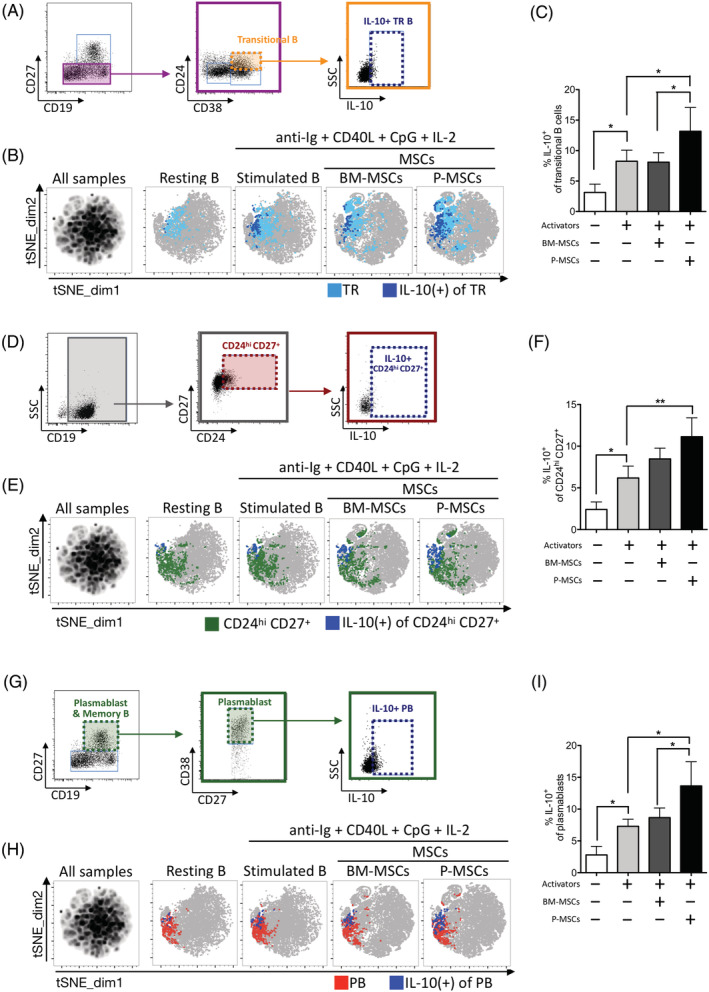
FIGURE 3.

Placenta mesenchymal stromal cells (P‐MSCs) significantly increase multiple populations of IL‐10‐producing regulatory B cells (Bregs) than bone marrow (BM)‐MSCs in vitro. A, Flow cytometric gating strategy for identifying IL‐10 producing transitional B cells (CD19+ CD27− CD38hi CD24hi IL‐10+). B, tSNE plots of IL‐10+ transitional B subset (five healthy donors) identified in experimental conditions as denoted, with overlay of manually gated IL‐10+ cells (navy blue) on transitional B cells (light blue); and C, pooled data. D, Flow cytometric gating strategy for identifying CD19+ CD27+ CD24hi IL‐10+ B cells. E, tSNE plots of IL‐10‐producing CD19+ CD24hi CD27+ B subset (five healthy donors) identified in experimental conditions as denoted, with overlay of manually gated IL‐10+ cells (navy blue) on CD19+ CD27+ CD24hi B cells (green); and F, pooled data. G, Flow cytometric gating strategy for identifying IL‐10+ plasmablasts (CD19+ CD27+ CD38hi IL‐10+). H, tSNE plots of IL‐10+ plasmablast subset (five healthy donors) identified in experimental conditions as denoted, with overlay of manually gated IL‐10+ cells (navy blue) on plasmablast B cells (red); and I, pooled data. tSNE plots (B,E,H) were generated by concatenation of individual samples. tSNE map of all samples (left‐most map) were generated from combining sample files of unstimulated resting B, stimulated B, coculture with BM‐MSCs (three donors), and coculture with P‐MSCs (three donors). tSNE analysis was run on 3000 live CD19+ single cells per sample using five markers: CD19, CD27, CD38, CD24, and IL‐10. All samples = 120 000 events; individual resting B and stimulated B samples = 15 000 events (n = 5); individual MSCs cocultured samples = 45 000 events (n = 15). PB, plasmablasts; TR, transitional B. Data are shown as mean ± SD. *P < .05; **P < .01; ***P < .001
