FIGURE 4.

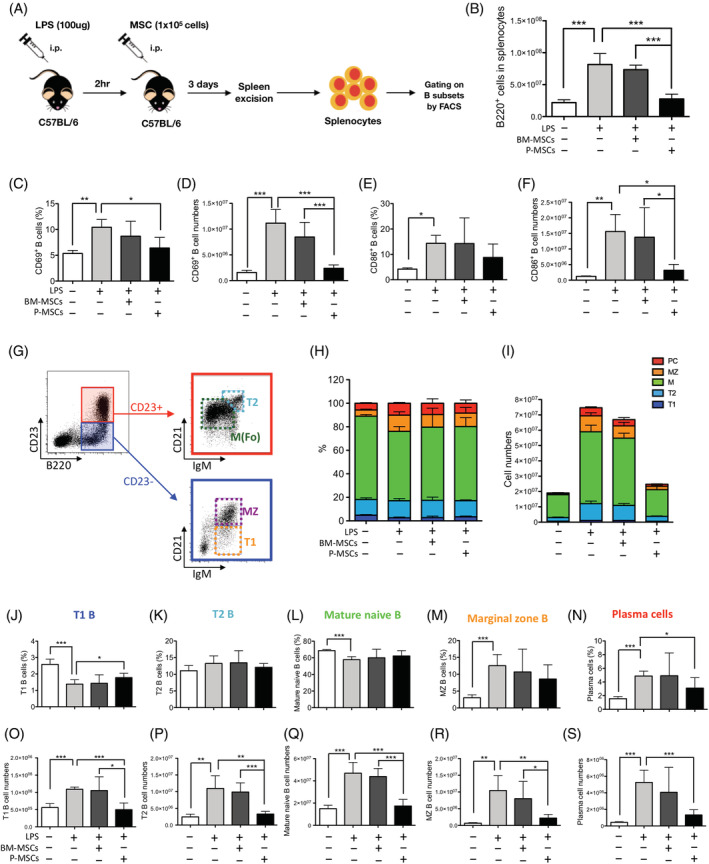
Placenta mesenchymal stromal cells (P‐MSCs) but not bone marrow (BM)‐MSCs significantly inhibit stimulated B‐cell proliferation/activation and increase transitional B‐cell subset percentages in vivo. A, Experimental schema of in vivo B‐cell activation using lipopolysaccharide (LPS) with adoptive transfer of hMSCs. Mice were intraperitoneally (i.p.) treated with LPS (100 μg/mouse), with i.p. injection of 1 × 10⁵ of BM‐MSCs or P‐MSCs 2 hours after. Mice were sacrificed 3 days later, with spleens excised for analysis of B‐cell populations. B, B220+ B‐cell numbers of LPS‐challenged mice without and with adoptive transfer of either human BM‐ or P‐MSCs. C, Cell percentages and, D, absolute cell numbers of CD69+ activated peripheral B220+ B cells; n = 5 in each experimental group. E, Cell percentages and, F, absolute cell numbers of CD86+ activated peripheral B220+ B cells; n = 5 in each experimental group. G, Flow cytometric gating strategy for identifying B‐cell subsets including transitional 1 B (T1B; B220+ CD23− IgMhi CD21int), transitional 2 B (T2B; B220+ CD23+ IgMhi CD21hi), mature naive B (B220+ CD23+ IgM−/int CD21int), and MZ B (MZ B; B220+ CD23− IgMhi CD21hi) subsets. H, Integrated data of B‐cell subset percentages. I, Integrated data of absolute B‐cell numbers. Each B subset percentages and absolute cell number are presented, respectively, as follows: J,O, transitional 1 B; K,P, transitional 2 B; L,Q, mature naive B; M,R, MZ B; and N,S, plasma cell. M, mature naive B; MZ, marginal zone B; PC, plasma cell; T1, transitional 1 B; T2, transitional 2 B. All percentage figures are gated on B220+ cells. Data are shown as mean ± SD. *P < .05; **P < .01; ***P < .001
