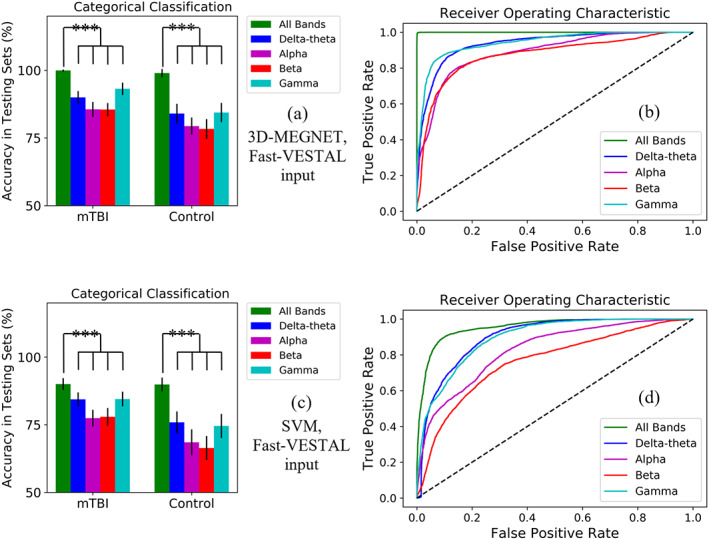
FIGURE 2.

Upper panel: Classification results from the five 3D MEGNET models with Fast‐VESTAL input. (a): 3D‐MEGNET's Percent accuracy in testing data sets in mTBI and control groups, plotted for all frequency bands combined (i.e., all‐band model, green bars), and for individual frequency bands separately. The inverted “U” shapes indicate the all‐band model was statistically more accurate than each of the individual frequency band models at p < .0001 (Mann–Whitney U test). (b): Operating characteristic (ROC) curves for all frequency bands combined (i.e., all‐band model, green curve), and for individual frequency bands separately. The True Positive Rate (i.e., Sensitivity on y‐axis) was plotted as the function of False Positive Rate (i.e., 1—Specificity on x‐axis). The dashed line represents a naive / non‐discretionary classifier. Probabilistic Classification data were used to calculate the ROC curves. Lower panel: Corresponding classification results for SVM models with Fast‐VESTAL input. (c) Percent accuracy in testing data sets for the SVM approach. (d) ROC curves for the SVM approach
