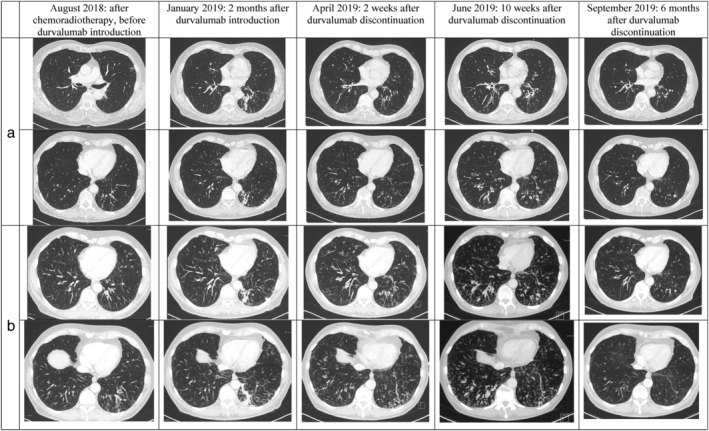
FIGURE 1.

Evolution of bronchiectasis and bronchiolitis lesions before, during and after durvalumab therapy; (a) chest computed tomography (CT) images, and (b) with maximum intensity projection (MIP) 5.0 mm post‐treatment. Lesions appeared to be more extensive in June 2019, 10 weeks after durvalumab discontinuation, and had fully disappeared in September 2019, six months after durvalumab discontinuation
