
FIGURE 4.
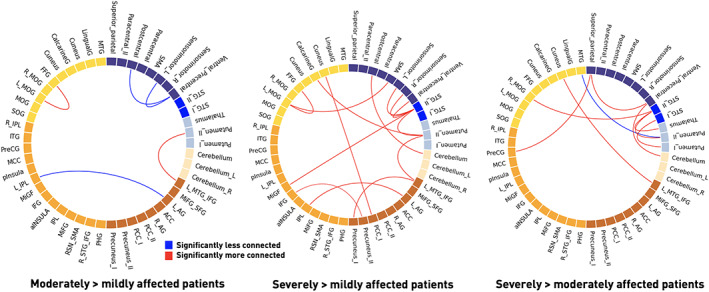
Significant dynamic connectivity differences between mildly, moderately and severely affected patient groups in State 1 (one‐way ANOVAs: p < .05, post hoc t tests: p < .05, FDR‐corrected). The functionally segregated state 1 comprised the most significantly altered connectivity pairs. Severely affected patients comprised numerous dynamic connectivity pairs with enhanced connectivity compared with both mildly and moderately affected patients. These changes primarily involved subcortical and cortical motor networks, as well as multiple connections to the default mode network