
FIGURE 5.
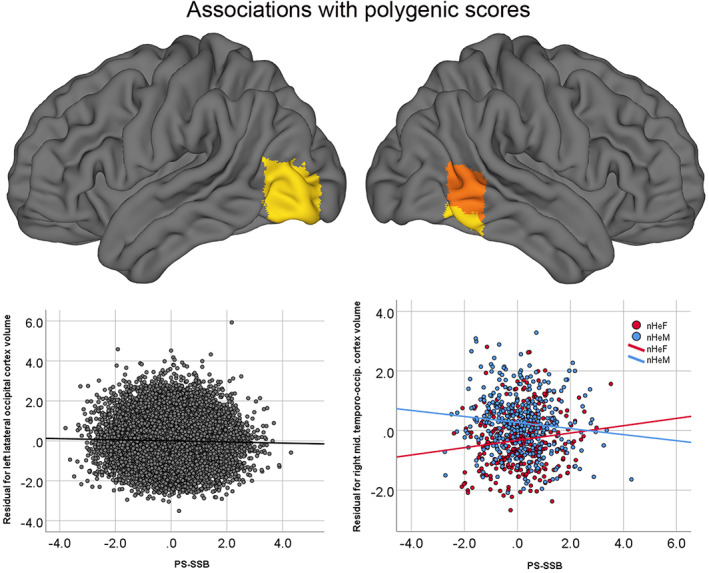
Associations between PS‐SSB and regional cortical volumes. Top panel: Regions for which significant associations with PS‐SSB were observed in the combined cohort (heterosexual and non‐heterosexual individuals together) are shown in yellow. Regions for which significant sex‐by‐PS‐SSB interactions (driven by non‐heterosexual individuals) were found are shown in orange. Bottom panel: Scatter plot showing the association with PS‐SSB and left lateral occipital cortex volume (top left; yellow) in the combined cohort. The association between PS‐SSB and right middle temporo‐occipital cortex (top right; orange) is shown on the bottom right displaying the sex‐by‐PS‐SSB interaction observed in nHeM and nHeF. SSB, same‐sex sexual behavior; PS‐SSB, polygenic score for SSB