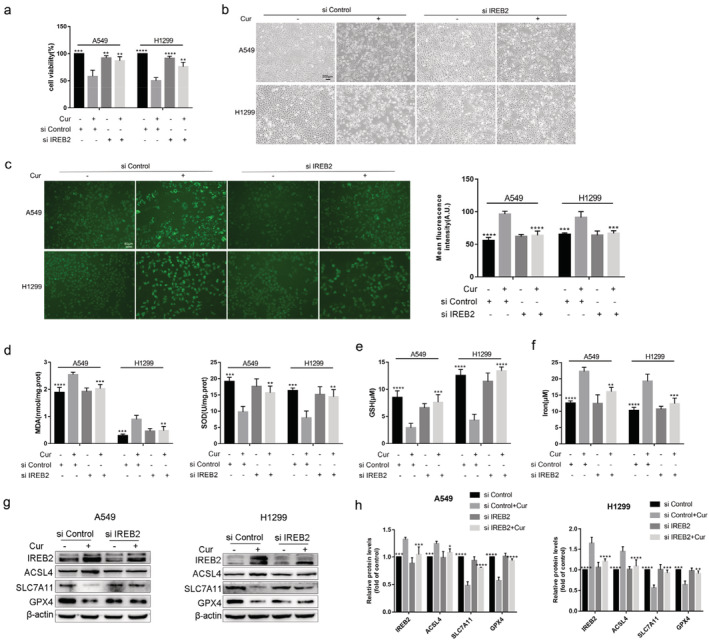
FIGURE 6.

The low expression of IREB2 weaken the sensitivity of A549 and H1299 cells to ferroptosis. (a) The viability of A549 and H1299 cells in siControl group, siControl+curcumin group, siIREB2 group, and siIREB2 + curcumin group. (b) Representative cell morphological changes in each group of cells (scale bar = 200 μm). (c)–(f) The contents of ROS, MDA, SOD, GSH, and iron in each group of cells. (g) The protein expression of IREB2, ACSL4, SLC7A11, and GPX4 in each group of cells. (h) Semi‐quantitative analysis of immunoblotting results. All experiments were done more than three times independently, and all results are expressed as the mean ± SD. *P < 0.05, **P < 0.002, ***P < 0.0002, ****P < 0.0001 versus siControl+curcumin group
