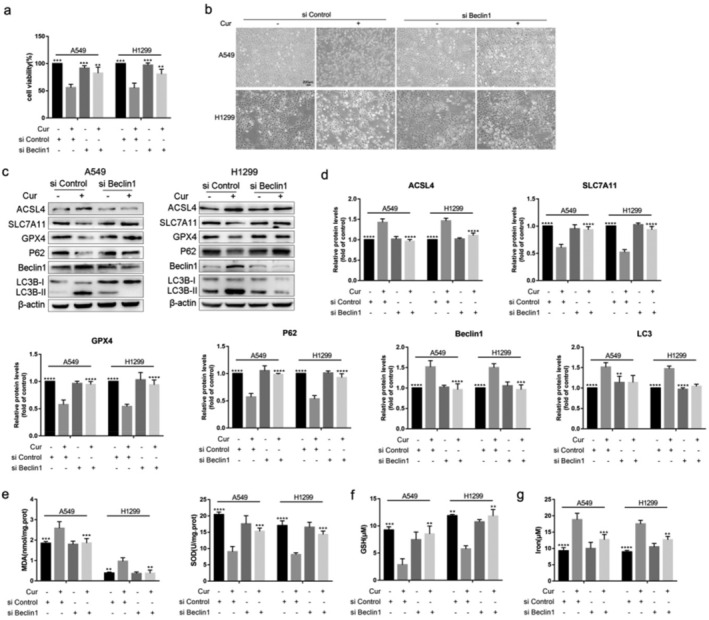
FIGURE 8.

Knockdown Beclin1 reverses ferroptosis related indicators in A549 and H1299 cells. (a) The viability of A549 and H1299 cells in siControl group, siControl+curcumin group, siBeclin1 group, and siBeclin1+curcumin group. (b) Representative cell morphological changes in each group of cells (scale bar = 200 μm). (c) The protein expression levels of P62, Beclin1, LC3, ACSL4, SLC7A11 and GPX4 in each group of cells. (d) Semi‐quantitative analysis of immunoblotting results. (e)–(g) The concentrations of MDA, SOD, GSH, and iron in each group of cells. All results are expressed as the mean ± SD. **P < 0.002, ***P < 0.0002, ****P < 0.0001 vs. siControl+curcumin group
