
FIGURE 3.
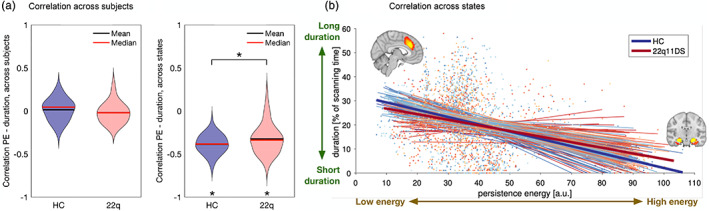
Correlation between persistence control energy and resting‐state activation duration. (a) Across subjects there is no significant correlation, either in patients with 22q11DS or in HCs. Violin plots show the distribution of correlations for all brain states. p = .434, T = −0.80. (b) Across states there is a negative correlation between the two modalities: the higher the persistence control energy, the shorter the resting‐state activation duration. This correlation is significantly stronger in HCs than in patients with 22q11DS. Left: Violin plots show the distribution of correlations for all subjects. Significant group differences (p <.05) are marked with an asterisk. p = .013, T = 2.50. Right: every line corresponds to the fitted linear curve for each subject, thick lines show the average correlation of each group. PE, persistence control energy