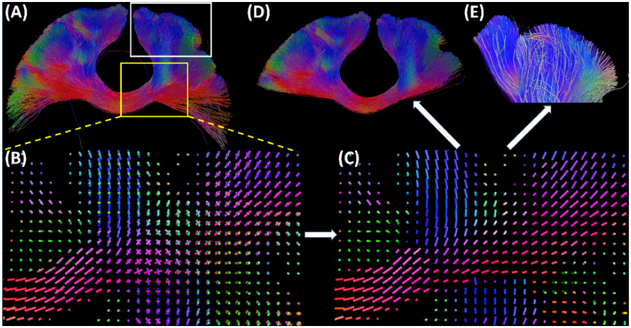
Figure 2.
Main steps in our topographic tract filtering algorithm. (A) Input tracts of the callosal motor (CM) pathway from FOD-based tractography. (B) The field of MVD from FOD peaks for the ROI highlighted by the yellow box in (A). (C) The PVF for the CM pathways computed by solving the MRF model. (D) The preserved fiber tracts after removing 30% of tracts with high VFD value. (E) For the ROI highlighted by the white box in (A), the 10% of tracts with the highest VFD values are plotted as white tubes together with the original input tracts. This help visualize the irregularity of the filtered tracts by our algorithm.

