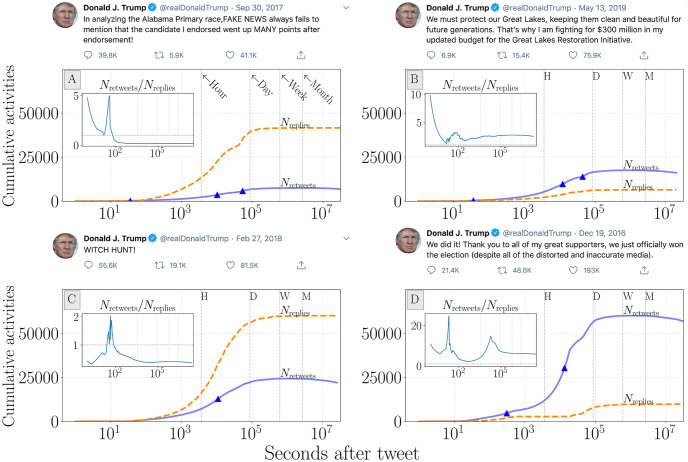
Fig 1. Time series for the cumulative sum of retweet and reply activities for four tweets authored by the Trump account after the 2016 presidential election.
The temporal axis is logarithmically spaced to show early-stage growth. Insets represent the cumulative ratio of Nretweets/Nreplies for the same time period. Vertical lines with H, D, W, M correspond to hour, day, week, and month intervals. Triangles indicate inflection points where the second derivative of retweet volume transitions from positive to negative (see Sec. 3.2 and Fig 6). The tweets examined here only provide some illustrative examples of how response activity time series behave. Direct links to tweets for panel (A): https://twitter.com/realDonaldTrump/status/914269704440737792, panel (B): https://twitter.com/realDonaldTrump/status/1128051913419837442, panel (C): https://twitter.com/realDonaldTrump/status/968468176639004672, and panel (D): https://twitter.com/realDonaldTrump/status/810996052241293312. Tweet screenshots were collected on May 28, 2020.

