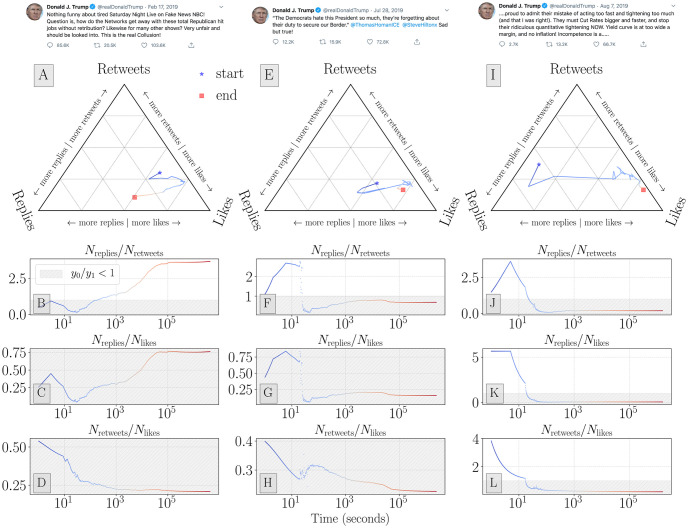
Fig 4. Ternary time series for three popular Trump tweets, selected to represent messages in approximately the upper 90th percentile, 50th percentile, and bottom 10th percentile of Nretweets/Nreplies ratios.
The time series represent observations from first activity observation to the final observation of the tweet. These ternary time series contrast the simple 2-dimensional ratio trajectories and illustrate example trajectories through the 3-dimensional ratio space. See S1 and S2 Figs for the distribution of ternary ratio values for Obama and Trump tweets over time. Each of these three tweets were authored on May 25, 2019. Direct links to tweets for panels (A–D) https://twitter.com/realDonaldTrump/status/1097116612279316480, panels (E–H) https://twitter.com/realDonaldTrump/status/1155657137076527104, and panels (I–L) https://twitter.com/realDonaldTrump/status/1159083364965654528. Screenshots were collected on May 28, 2020.

