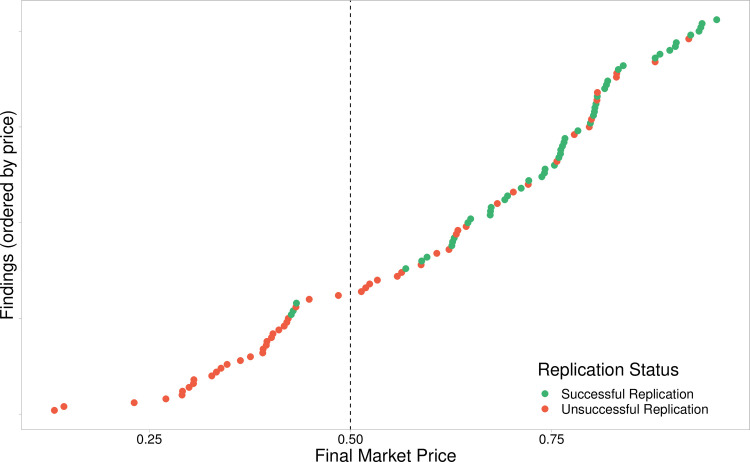
Fig 1. Market beliefs.
This figure plots the final prices of the 103 markets included within this dataset ordered by price. The green dots represent successful replications, and the non-replications are represented by the red dots. The horizontal line at 0.5 indicates the binary cut off used to determine the markets aggregated prediction.

