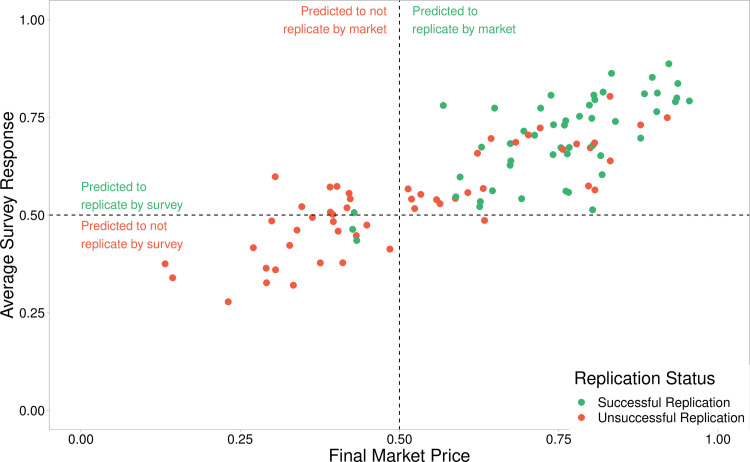
Fig 3. Market and survey correlations.
Final Market Prices and average survey responses are highly correlated (rs(101) = .837, p < .001; r(101) = .853, p < .001). The dotted horizontal and vertical lines indicate the 0.5 cut off points used when applying a binary forecasting approach. The top left quadrant represents those findings which are predicted to replicate by survey but predicted to not replicate by market. The top right and bottom left quadrants contain findings where the markets and surveys agree, predicted to replicated and to not replicate respectively. The bottom right quadrant with a single finding, is where the study is predicted to replicate by the market but not by the survey. The colours of the findings show the replication outcome, with green indicating a successful replication outcome, and red indicating unsuccessful replication.

