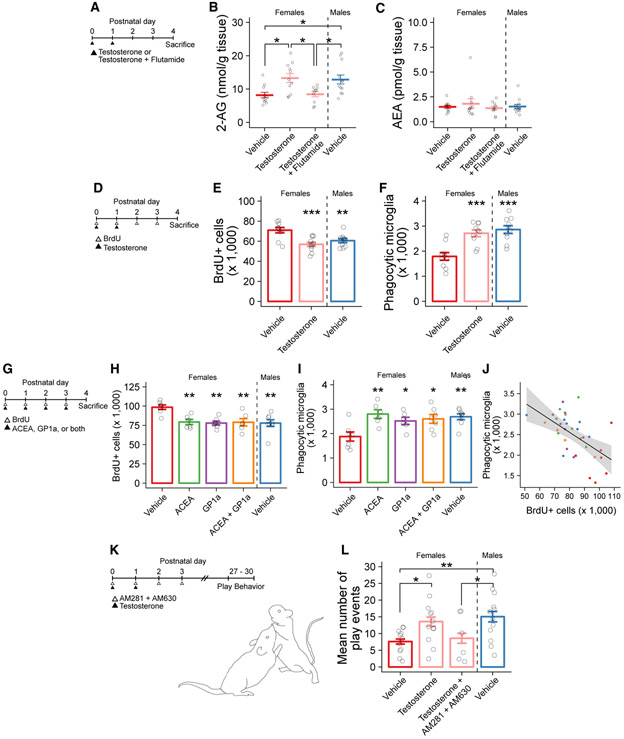
Figure 3. Testosterone Masculinizes Female 2-AG Content, Newborn Cell Number, and Phagocytic Microglia Number in the Developing Amygdala.
(A) Schematic showing the treatment paradigm and timeline for (B) and (C).
(B) Quantification of 2-AG levels measured by mass spectrometry in amygdala tissue. ANOVA F(3, 40) = 5.83; p = 0.00211. Holm-Bonferroni post hoc comparisons between groups are shown. n = 10–12 rats per group.
(C) Quantification of AEA levels measured by mass spectrometry in amygdala tissue. n = 10–12 rats per group.
(D) Schematic showing the treatment paradigm and timeline for (E) and (F).
(E) Quantification of the number of BrdU+ cells. ANOVA F(2, 28) = 10.38; p = 0.000423. Dunnett’s post hoc comparisons to female vehicle are shown. n = 10–11 rats per group.
(F) Quantification of the number of phagocytic microglia. ANOVA F(2, 27) = 15.75; p = 2.92e–05. Dunnett’s post hoc comparisons to female vehicle are shown. n = 10 rats per group.
(G) Schematic showing the treatment paradigm and timeline for (H)–(J).
(H) Quantification of the number of BrdU+ cells. ANOVA F(4, 29) = 5.95; p = 0.00127. Dunnett’s post hoc comparisons to female vehicle are shown. n = 6–8 rats per group.
(I) Quantification of the number of phagocytic microglia. ANOVA F(4, 29) = 4.976; p = 0.00353. Dunnett’s post hoc comparisons to female vehicle are shown. n = 6–8 rats per group.
(J) Correlation between the number of BrdU+ cells and phagocytic microglia in the same histological sections (data from H and I). Pearson’s product-moment correlation r(32) = −0.566; p = 0.004788. Filled circles indicate individual data points for each animal; colors indicate treatment group as used in (H) and (I). Black line indicates linear regression; gray shaded region indicates 95% confidence interval.
(K) Schematic showing the treatment paradigm and timeline for (L).
(L) Quantification of the mean number of play events from P27 to P30. ANOVA F(3, 37) = 3.532; p = 0.024. Post hoc Welch’s t test for specific comparisons is shown. n = 6–12 rats per group over 4 days of play testing.
Bars represent the mean ± SEM. Vertical dashed line indicates separation of male from female groups. Open circles represent individual data points for each animal. *p < 0.05, **p < 0.01, and ***p < 0.001.
See also Figure S3.

