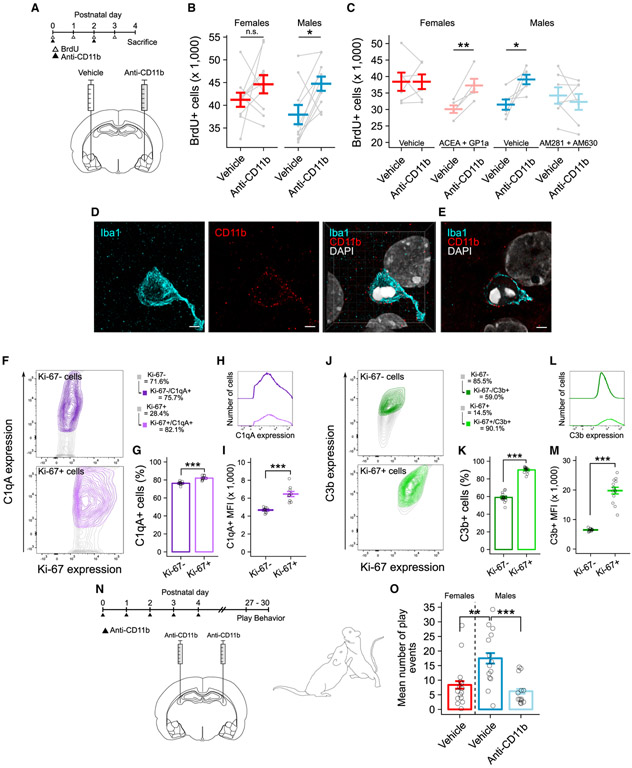
Figure 4. Endocannabinoids Direct Male Microglia to Engulf Viable Newborn Cells in a Complement-Dependent Manner.
(A) Schematic showing the treatment paradigm and timeline for (B) and (C).
(B) Quantification of the number of BrdU+ cells between anti-CD11b treated and untreated hemispheres. Paired t test: females t(9) = −1.1924, p = 0.2636; males t(9) = −3.1369, p = 0.01199. n = 10 rats per sex.
(C) Quantification of the number of BrdU+ cells between anti-CD11b-treated and untreated hemispheres. Paired t test: female vehicle t(5) = −0.0004, p = 0.9997; female agonist t(4) = −5.199, p = 0.006521; male vehicle t(5) = −3.2157, p = 0.02358; male antagonist t(6) = 0.8718, p = 0.4168. n = 5–7 rats per group.
(D) Maximum intensity projection of Iba1 (left) and CD11b (middle) and resulting merged three-dimensional projection (right) of the phagocytic cup showing membrane localization of CD11b and DAPI colocalization within the cup. Scale bars and grid lines represent 2 μm.
(E) Single confocal plane of the merged image in (D). Scale bar and grid lines represent 2 μm.
(F) Contour plots showing the relationship between Ki-67 and C1qA expression analyzed by flow cytometry on P4. Data are quantified in (G) and (I). See Figures S4G and S4I for gating strategy.
(G) Quantification of the percent of C1qA+ cells. Paired t test t(9) = −10.282; p = 2.873e–06. n = 10 independent samples, both sexes combined.
(H) Median fluorescence intensity (MFI) plot of C1qA expression on Ki-67+ and Ki-67− cell populations. Data are quantified in (I).
(I) Quantification of C1qA MFI. Paired t test t(8) = −7.5241; p = 3.124e–08. n = 9 independent samples, both sexes combined.
(J) Contour plots showing the relationship between Ki-67 and C3b expression analyzed by flow cytometry on P4. Data are quantified in (K) and (M). See Figures S4H and S4J for gating strategy.
(K) Quantification of the percent of C3b+ cells. Paired t test t(13) = −21.086; p = 1.947e–11. n = 14 independent samples, both sexes combined.
(L) MFI plot of C3b expression on Ki-67+ and Ki-67− cell populations. Data are quantified in (M).
(M) Quantification of C3b MFI. Paired t test t(12) = −12.478; p = 3.124e−08. n = 13 independent samples, both sexes combined.
(N) Schematic showing the treatment paradigm and timeline for (O).
(O) Quantification of the mean number of play events from P27 to P30. ANOVA F(2, 40) = 8.807; p = 0.00677. Post hoc Welch’s t test for specific comparisons is shown. n = 13–16 rats per group over 4 days of play testing.
Bars represent the mean ± SEM. Open circles represent individual data points for each sample. Gray lines connect data points between hemispheres for each individual animal in (B) and (C). Contour lines in (F) and (J) represent 95% of the data at 5% intervals. *p < 0.05, **p < 0.01, and ***p < 0.001
See also Figure S4.

