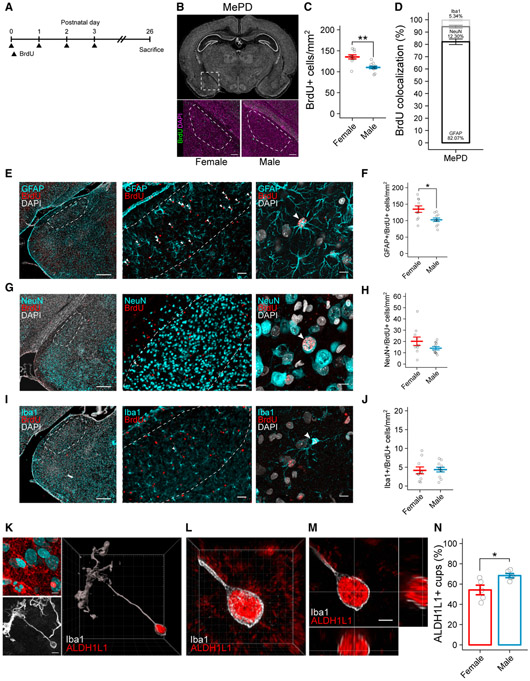
Figure 5. Neonatally Born Cells Differentiate into Astrocytes by the Juvenile Age, with More in the Female Posterodorsal Medial Amygdala.
(A) Schematic showing the treatment paradigm and timeline for (B)–(J).
(B) Nissl-stained coronal section of the P26 brain (top). Dashed box indicates location of the MePD. Representative images of female (bottom left) and male (bottom right) sections immunolabeled for BrdU and DAPI are shown. Dashed lines indicate boundaries of the MePD. Scale bars represent 150 μm.
(C) Quantification of the density of BrdU+ cells in the MePD at P26. Welch’s t test t(16.338) = 3.9763; p = 0.004184. n = 10 or 11 rats per sex.
(D) Quantification of the percent of BrdU+ cells colocalized with GFAP, NeuN, and Iba1 in the MePD. Data represent both sexes combined.
(E) Representative coronal section of the P26 amygdala immunolabeled for GFAP, BrdU, and DAPI (left). Representative 20×field of view shows GFAP and BrdU labeling in the MePD (middle). Maximum intensity projection (MIP) shows GFAP, BrdU, and DAPI colocalization (right). Dashed lines indicate boundaries of the MePD. White arrowheads indicate GFAP+/BrdU+ colocalization. Scale bars represent 400 μm (left), 50 μm (middle), and 10 μm (right).
(F) Quantification of the density of GFAP+/BrdU+ cells in the MePD. Welch’s t test t(13.904) = 2.8891; p = 0.01196. n = 10 or 11 rats per sex.
(G) Representative coronal section of the P26 amygdala immunolabeled for NeuN, BrdU, and DAPI (left). Representative 20× field of view shows NeuN and BrdU labeling in the MePD (middle). MIP shows NeuN, BrdU, and DAPI colocalization (right). Dashed lines indicate boundaries of the MePD. White arrowheads indicate NeuN+/BrdU+ colocalization. Scale bars represent 400 μm (left), 50 μm (middle), and 10 μm (right).
(H) Quantification of the density of NeuN+/BrdU+ cells in the MePD. n = 10 or 11 rats per sex.
(I) Representative coronal section of the P26 amygdala immunolabeled for Iba1, BrdU, and DAPI (left). Representative 20× field of view shows Iba1 and BrdU labeling in the MePD (middle). MIP shows Iba1, BrdU, and DAPI colocalization (right). Dashed lines indicate boundaries of the MePD. White arrowheads indicate Iba1+/BrdU+ colocalization. Scale bars represent 400 μm (left), 50 μm (middle), and 10 μm (right).
(J) Quantification of the density of Iba1+/BrdU+ cells in the MePD. n = 10 or 11 rats per sex.
(K) MIP of ALDH1L1 and DAPI (top left) and Iba1 (bottom left). White arrowhead indicates phagocytic cup. Three-dimensional rendering of a P4 phagocytic microglia shows ALDH1L1 colocalized within a phagocytic cup (right). Scale bars and grid lines represent 5 μm.
(L) Three-dimensional projection of ALDH1L1 localized within the phagocytic cup. Grid lines represent 1 μm.
(M) Orthogonal views of the phagocytic cup demonstrating colocalization of ALDH1L1 within the cup. Grid lines represent 2 μm. Voxel size = 0.0124 × 0.0124 × 0.1 μm.
(N) Quantification of the percentage of phagocytic cups that contain ALDH1L1. Welch’s t test t(5.4415) = −2.7408; p = 0.03728. n = 5 females (120 cups) and 5 males (120 cups).
Bars represent the mean ± SEM. Open circles represent individual data points for each animal. MePD, posterodorsal medial amygdala. *p <0.05and ***p < 0.001.
See also Figure S5.

