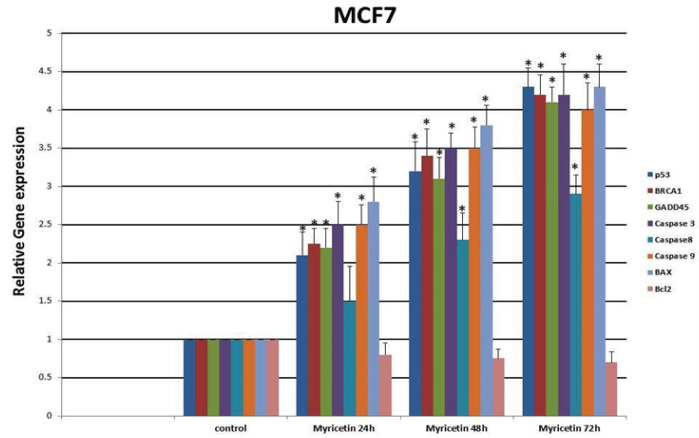
Figure 5.
Real-Time PCR Gene Expression Analysis of MCF-7 Cells Treated by 54 µm Myricetin for 24, 48, and 72 hrs. The expression of P53, BRCA1, GADD45, Caspase-3, Caspase-8, Caspase-9 and BAX increased and the expression of the Bcl2 gene decreased significantly by time compared to control group. Data are represented as mean ± SD. *p<0.01

