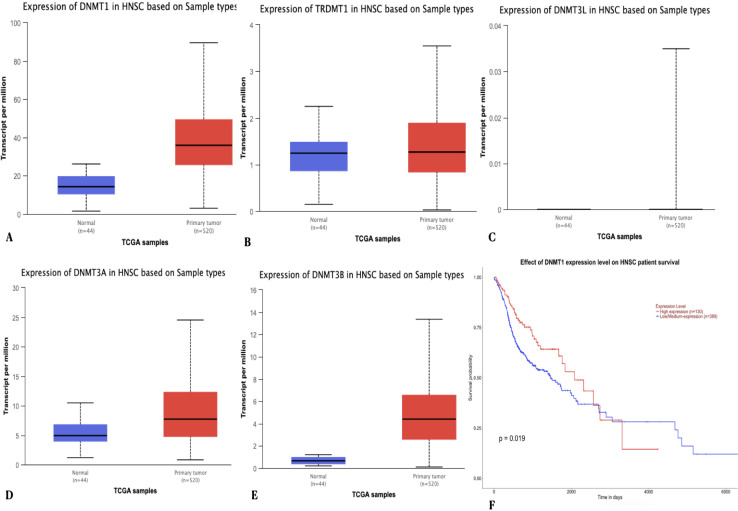
Figure 2.
The Box Whisker Plot and Kaplan Meier Survival Analysis Demonstrating Differential Gene Expression Pattern and Survival Probability of HNSCC Patients Respectively. Upregulation of genes (A) DNMT1 (B) TRDMT1 (C) DNMT3A (D) DNMT3B and (E) DNMT3L when compared to normal samples. (F) The survival plot showed that the low/medium level expression of DNMT1 gene resulted in lower survival probability when compared to patients with high level expression

