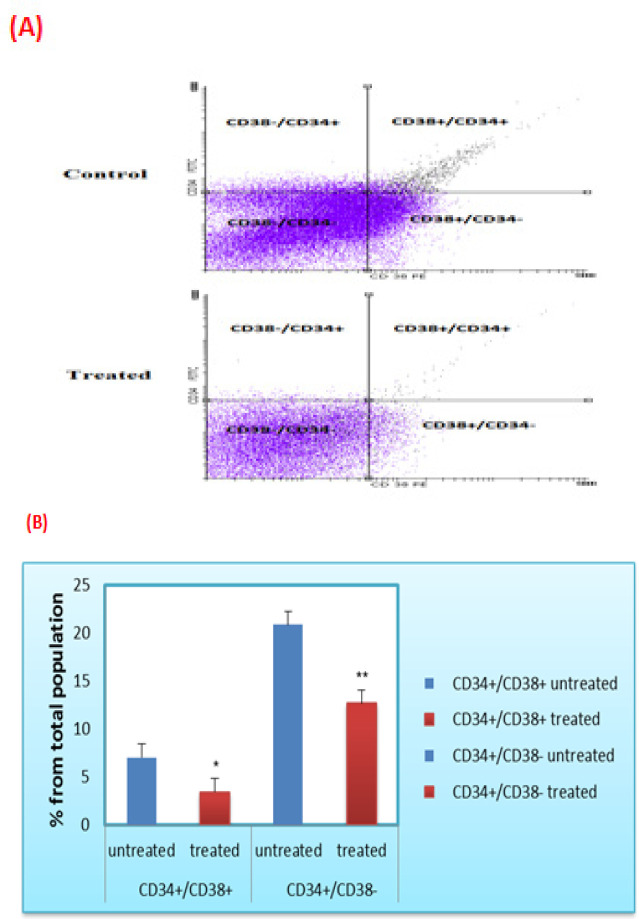
Figure 2.
Cytotoxic Effect of L.C. Leaves Extract on the LSCs. (A) Flow cytmetry dot plot chart represents CD38/CD34 ratio before and after treatment with the extract. The first and second quadrants represent acute lymphoblastic leukemic stem cells. (B) The ratio of CD34+/CD38+ and CD34+/CD38-populations was evaluated by flow cytometry before and after treatment with the extract. Data was expressed as mean ± SEM (* P<0.05) and (** P<0.01) compared to the untreated cells

