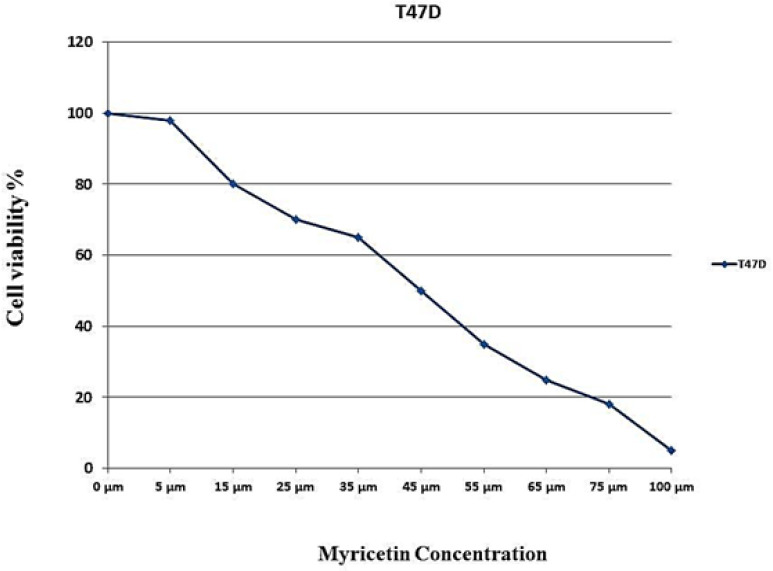
Figure 1.
IC50 Assay for Half-Maximal Inhibitory Concentration Analysis of Myricetin in T47-D Cancer Cells after 24 Hours of Treatment. Cells were treated with or without the myricetin in serial dilutions (175, 125, 100, 75, 50, 25 and10 μM), and the relative amount of viable cells were estimated by measuring the absorbance of the cell suspension after incubation. MTT was carried out and a dose response graph of viability versus myricetin concentration used to calculate IC50 values for T47-D cells. The graph pointed the concentration of 46 µM as IC50 for myricetin

