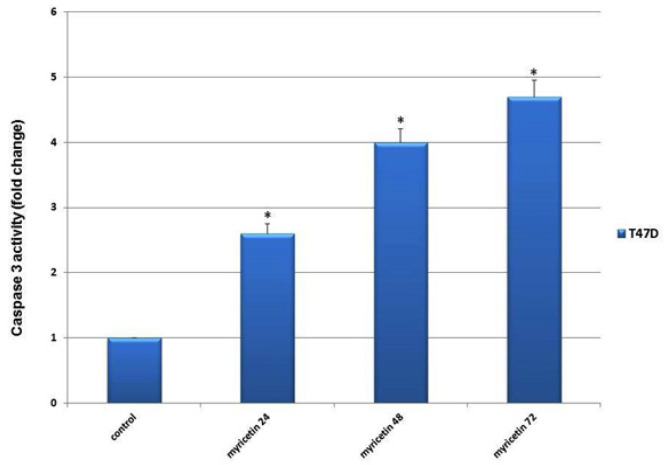
Figure 5.
The Caspase-3 Activity in T47-D Breast Cancer Cells Plotted Against duration of Exposing Cells to 46 µm Myricetin (24, 48 and 72 hrs). The Caspase-3 activity increased with time significantly compared to control group. The data is expressed as the percentage of cells that show a cytoplasmic fluorescence intensity greater than 450 (Z’= 0.51)

