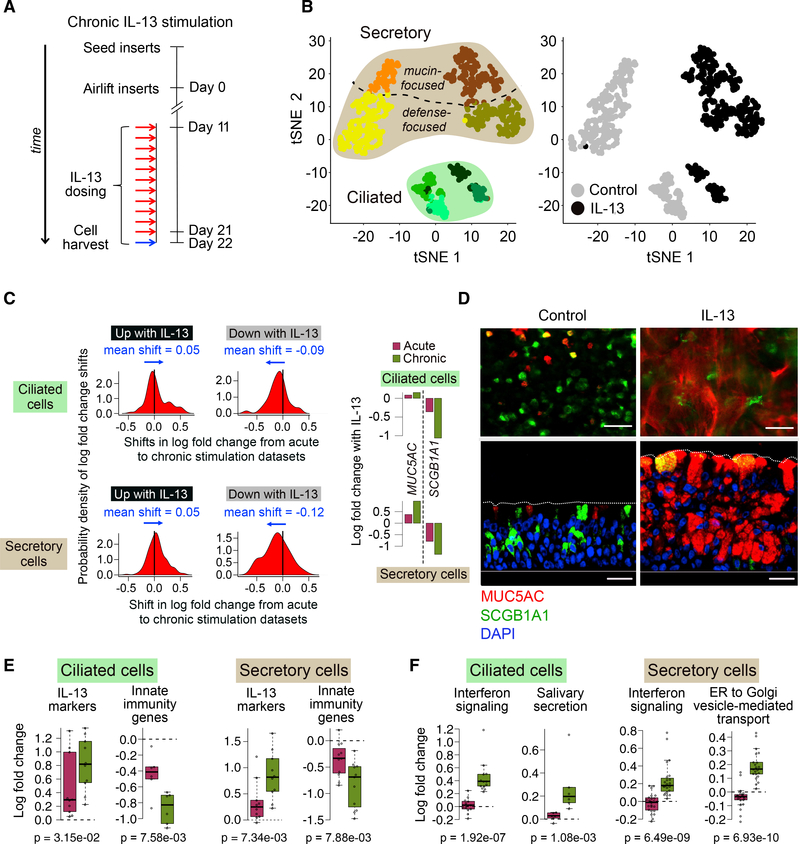
Figure 5. Chronic IL-13 Completes Epithelium-wide Metaplasia and Promotes Both ER Stress and Interferon Responses in Ciliated Cells.
(A) Schematic detailing human AEC ALI mucociliary differentiation followed by chronic stimulation with IL-13 of cells; n = 2 HTEC donors (T71, T72).
(B) t-SNE plot overlaying cell clusters (left) or cell treatment (right) for 789 cells from experiment in (A).
(C) Density plots show probability distribution (on the basis of a kernel density function) of shifts in log fold change between acute and chronic datasets for genes up (left) or downregulated (right) with IL-13 in ciliated (top) or secretory (mucus + defense) cells (bottom). All shifts significant with t test p values < 0.05. Bar plots compare log fold changes in MUC5AC and SCGB1A1 between acute and chronic IL-13.
(D) Immunofluorescence (IF) labeling of ALI-differentiated human AEC cultures in top-down (top) and side (bottom) views show control cultures (left) dominated by SCGB1A1+ (green)/MUC5AC− (red) cells transformed by chronic IL-13 into SCGB1A1−/MUC5AC+-dominated cultures (right). Co-staining (yellow); DAPI nuclei (blue); scale bar, 30 μm; n = 3 HTEC donors (same as in Figure 3A).
(E) Boxplots show mean log fold change of IL-13 markers and innate immunity genes responding significantly more strongly with chronic than acute IL-13. p values (p) are based on one-sided Wilcoxon tests.
(F) Boxplots show mean log fold change of enriched annotated gene sets composed of genes exhibiting significantly stronger responses with chronic compared with acute IL-13. p values (p) are based on one-sided Wilcoxon tests.
See also Figure S3.

