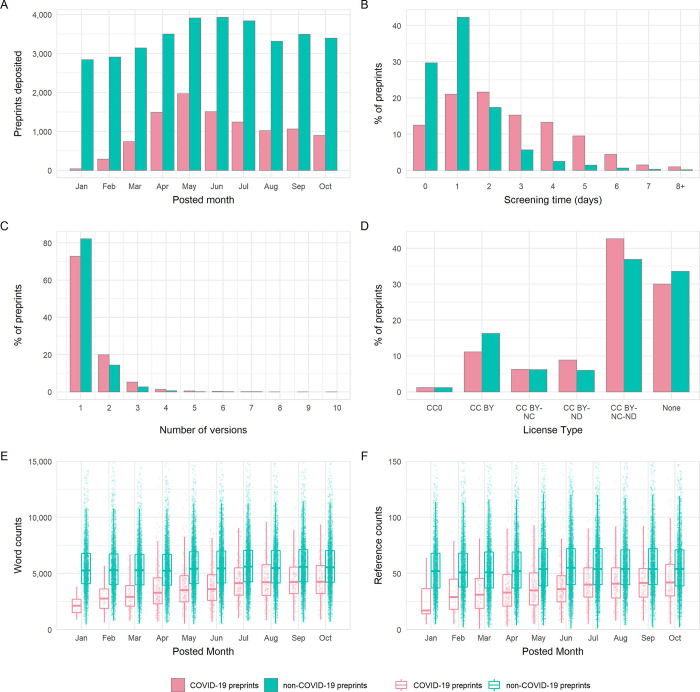
Fig 2. Comparison of the properties of COVID-19 and non-COVID-19 preprints deposited on bioRxiv and medRxiv between January 1 and October 31, 2020.
(A) Number of new preprints deposited per month. (B) Preprint screening time in days. (C) License type chosen by authors. (D) Number of versions per preprint. (E) Boxplot of preprint word counts, binned by posting month. (F) Boxplot of preprint reference counts, binned by posting month. Boxplot horizontal lines denote lower quartile, median, upper quartile, with whiskers extending to 1.5*IQR. All boxplots additionally show raw data values for individual preprints with added horizontal jitter for visibility. The data underlying this figure may be found in https://github.com/preprinting-a-pandemic/pandemic_preprints and https://zenodo.org/record/4587214#.YEN22Hmnx9A. COVID-19, Coronavirus Disease 2019.

