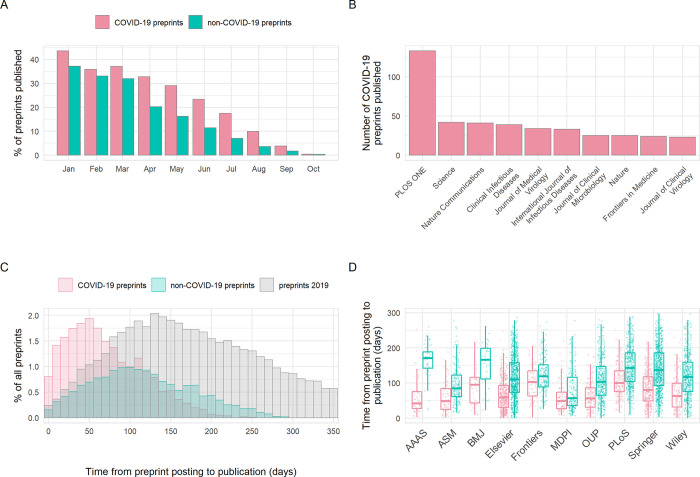
Fig 4. Publication outcomes of COVID-19 and non-COVID-19 preprints deposited on bioRxiv and medRxiv between January 1 and October 31, 2020.
(A) Percentage of COVID-19 versus non-COVID-19 preprints published in peer-reviewed journals, by preprint posting month. (B) Destination journals for COVID-19 preprints that were published within our analysis period. Shown are the top 10 journals by publication volume. (C) Distribution of the number of days between posting a preprint and subsequent journal publication for COVID-19 preprints (red), non-COVID-19 preprints posted during the same period (January to October 2020) (green), and non-COVID-19 preprints posted between January and December 2019 (grey). (D) Time from posting on bioRxiv or medRxiv to publication categorised by publisher. Shown are the top 10 publishers by publication volume. Boxplot horizontal lines denote lower quartile, median, upper quartile, with whiskers extending to 1.5*IQR. All boxplots additionally show raw data values for individual preprints with added horizontal jitter for visibility. The data underlying this figure may be found in https://github.com/preprinting-a-pandemic/pandemic_preprints and https://zenodo.org/record/4587214#.YEN22Hmnx9A. COVID-19, Coronavirus Disease 2019.

