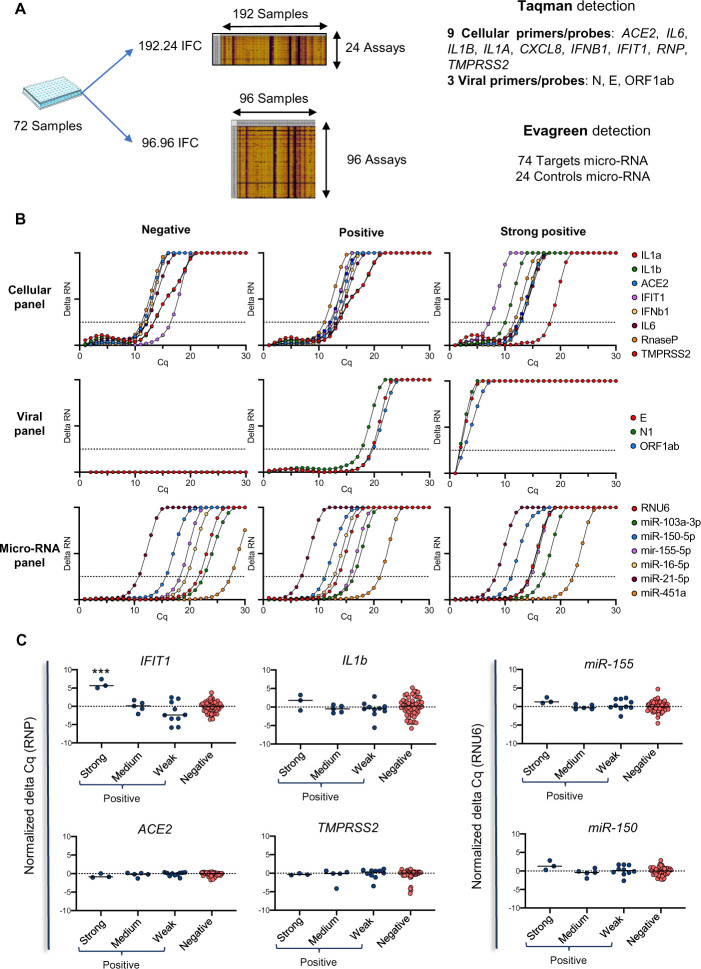
Fig 3. Use of the Biomark-based protocol to analyze the host response to SARS-CoV-2 infection at the mRNA and microRNA levels.
(A) Overview of the analysis strategy on 72 patient samples. They were divided into 4 groups, according to their viral load, from negative, weak (Cq for viral probes >20), medium (20 > Cq for viral probes >10) and strong (Cq for viral probes < 10) SARS-CoV-2 positive. (B) Typical amplification curves of the different genes (cellular, viral and micro-RNA) on three different SARS-CoV-2 patient status. (C) Modulation of cellular markers in the different groups of patients according to their SARS-CoV-2 viral load. IFIT1 expression was statistically elevated (p < 0.001) in the strong COVID-19-positive samples compared to the three other groups considered separately. The Cq presented are representative of two independent experiments performed in quadruplicate.

