
Fig. 2. Single-cell RNA-seq (scRNA-seq) analysis of nS/MARt CAR-T cells.
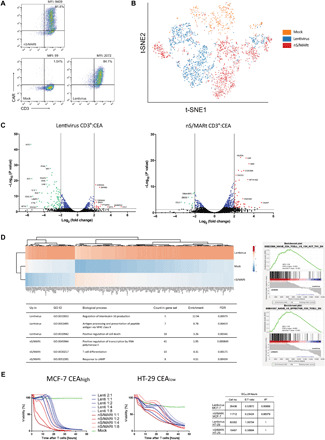
CEA-CAR T cells generated by electroporation with nS/MARt or by transduction with a vesicular stomatitis virus–pseudotyped lentivirus were analyzed by FACS for the expression of the transgene in comparison to mock cells (A). The modified cells were then analyzed with the ESCAPE RNA-seq proteogenomic platform (Proteona). t-SNE (t-distributed stochastic neighbour embedding) projection of RNA-seq reads are shown. Colors indicate clusters of cells identified by the transfection method (n = 2757 cells) (B). Volcano plots display the transcriptional profile of lentivirally transduced CAR-T cells and nS/MARt electroporated CAR-T cells versus mock T cells (C). The top 100 up-regulated genes in cells transduced with lentivirus underwent hierarchical cluster analysis in comparison with untransfected and electroporated cells. GO term analysis was performed on the full list of significantly up-regulated genes in each respective transfection method using GO terms and the PANTHER classification system. GSEA of all differentially expressed genes for each modified T cell approach reveals a more naïve T cell phenotype after nS/MARt transfection (D). The efficacy of tumor target killing was investigated in a real-time in vitro cytotoxicity assay. Target cells (2.5 × 10⁴), either with a high (MCF-7) or a low (HT-29) expression of the target epitope CEA, were seeded at day 0, and the effector CEA-CAR T cells were added at day 1 at different effector-to-target ratios. The EC50 for effector CAR-T cells generated with the lentivirus and nS/MARt was estimated (E).