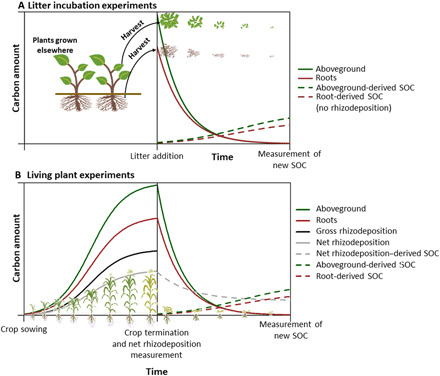
Fig. 1. Schematic representation of C dynamics in litter incubation experiments and living plant experiments.

(A) For litter incubation experiments, we illustrate the decrease of root and aboveground C and the formation of new SOC derived from each C-input source. (B) In living plant experiments, we also show C contents in plant biomass and associated gross and net rhizodeposition, as defined by Pausch and Kuzyakov (10). Plant biomass C and gross rhizodeposition are shown as solid lines, and new SOC is shown in dashed lines. The SOCFE of each C-input source is defined as the relation between new SOC derived from a particular C-input source and the amount of C-input added at litter addition (A) or at crop termination (B).
