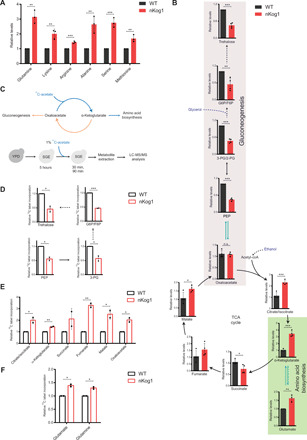
Fig. 2. Kog1 balances carbon flux between amino acid biosynthesis and gluconeogenesis.

(A and B) Relative steady-state amounts of specific amino acids, gluconeogenic intermediates, and TCA cycle metabolites in WT and nKog1 cells after 5-hour shift to SGE medium. Data are represented as means ± SD (n = 3 for amino acids and n = 4 for gluconeogenic and TCA cycle intermediates). Also see fig. S2 (A to E). (C) Experimental design for 13C stable isotope label incorporation of metabolites using 13C-acetate in SGE media to estimate metabolic flux through the respective pathways. G6P, glucose-6-phosphate; F6P, fructose-6-phosphate; PEP, phosphoenolpyruvate; 3-PG, 3-phosphoglycerate, 2-PG, 2-phosphoglycerate; Acetyl-CoA, acetyl coenzyme A. (D) Relative 13C label incorporation in gluconeogenic intermediates after a 30-min pulse of 1% 13C-acetate after 5-hour shift to SGE media. Data are represented as means ± SD (n = 2). Also see fig. S2F. (E) Relative 13C label incorporation in TCA cycle intermediates in WT and nKog1 cells, measured after a 90-min pulse of 1% 13C-acetate after 5-hour shift to SGE media. Data are represented as means ± SD (n = 2). Also see fig. S2G. (F) Relative 13C label incorporation in glutamate and glutamine in WT and nKog1 cells, measured after a 90-min pulse of 1% 13C-acetate after 5-hour shift to SGE media. Data are represented as means ± SD (n = 2). For all panels, *P < 0.05, **P < 0.01, and ***P < 0.001; n.s., nonsignificant difference (unpaired Student’s t test).
